 geocatalogue.geoportail.lu
SHAPE
Type of resources
Available actions
Topics
Provided by
Groups
Years
Formats
Representation types
Update frequencies
status
Scale
-

Project for delimitating the winegrowing areas in Luxemburg
-

Current status of FLIK parcels after the annual update of the agricultural parcel reference system. The update was performed from the beginning of May to the end of July based on the latest national aerial photos (orthophotos) from 2025. This layer is provisionally and the geometry changes are being validated by the concerned farmers in the course of the participation process (border adjustments, merge and division of parcels with new FLIK numbers, size changes, etc.).
-
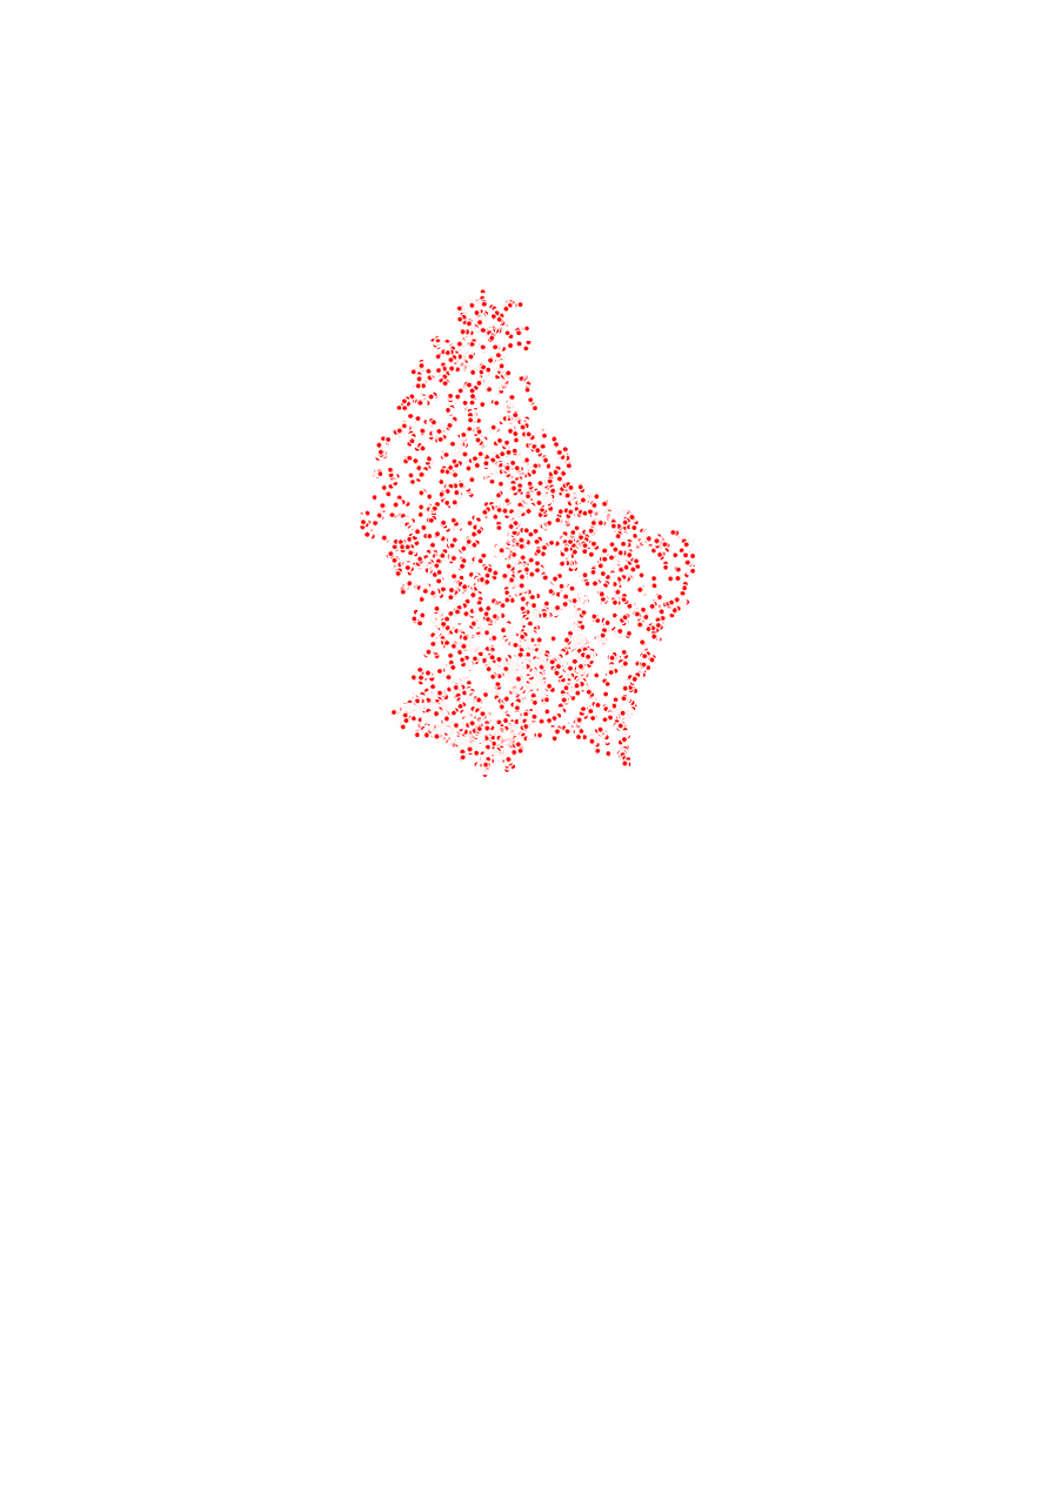
This layer contains the addresses from the official address data set created and managed by the Administration du Cadastre et de la Topographie (ACT). The street names correspond to the official national street names and town name register, the Registre National des Localités et des Rues (CACLR), which is also managed by ACT. The address points are placed in the respective centres of the largest building or of the parcel.
-

FLIK parcel of the previous year (2024)
-

- European air quality index (based on pollutant concentrations in µg/m3): hourly measurements for the pollutant O3 for the most recent hour for each station - The sub-index O3 is available according to the type of station (industrial, background or traffic) in accordance with the methodology for calculating the European air quality index for the measuring stations throughout the Greater Region. - Data depth: The most recent index for the last 3 hours for each station is available hourly. If the calculation of the sub-index is not possible due to lack of data, its value is marked by a grey dot in the symbology of the map (data not available). - Data sources: ATMO Grand Est; Agence Wallonne de l'Air et du Climat - AWAC; Landesamt für Umwelt- und Arbeitsschutz Saarland - IMMESA; Landesamt für Umwelt Rheinland-Pfalz - ZIMEN; Administration de l'environnement Luxembourg. Harmonization: ATMO Grand Est and GIS-GR 2020
-
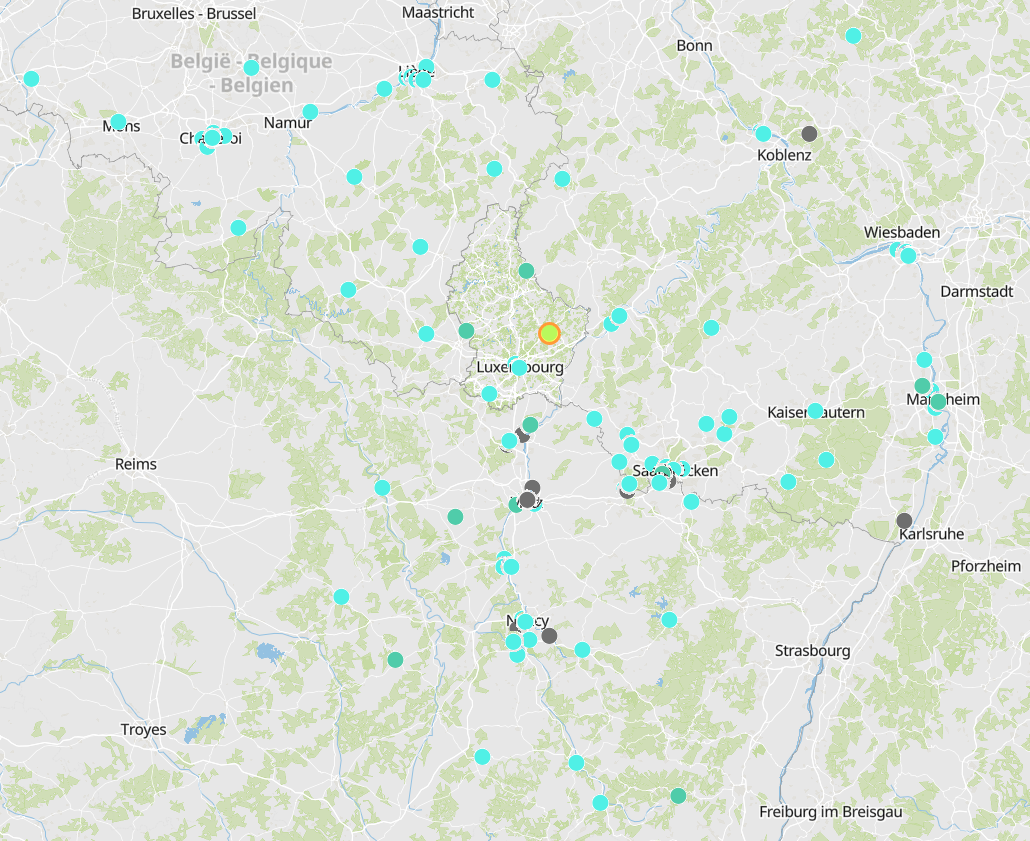
- European air quality index (based on pollutant concentrations in µg/m3): measurements over the last 100 days for each station - The sub-indices O3, PM10, PM2.5, NO2, and SO2 are available according to the type of station (industrial, background or traffic) in accordance with the methodology for calculating the European air quality index for the measuring stations throughout the Greater Region. - Data sources: ATMO Grand Est; Agence Wallonne de l'Air et du Climat - AWAC; Landesamt für Umwelt- und Arbeitsschutz Saarland - IMMESA; Landesamt für Umwelt Rheinland-Pfalz - ZIMEN; Administration de l'environnement Luxembourg. Harmonization: ATMO Grand Est and GIS-GR 2020
-

Project for delimitating the small winegrowing areas in Luxemburg
-
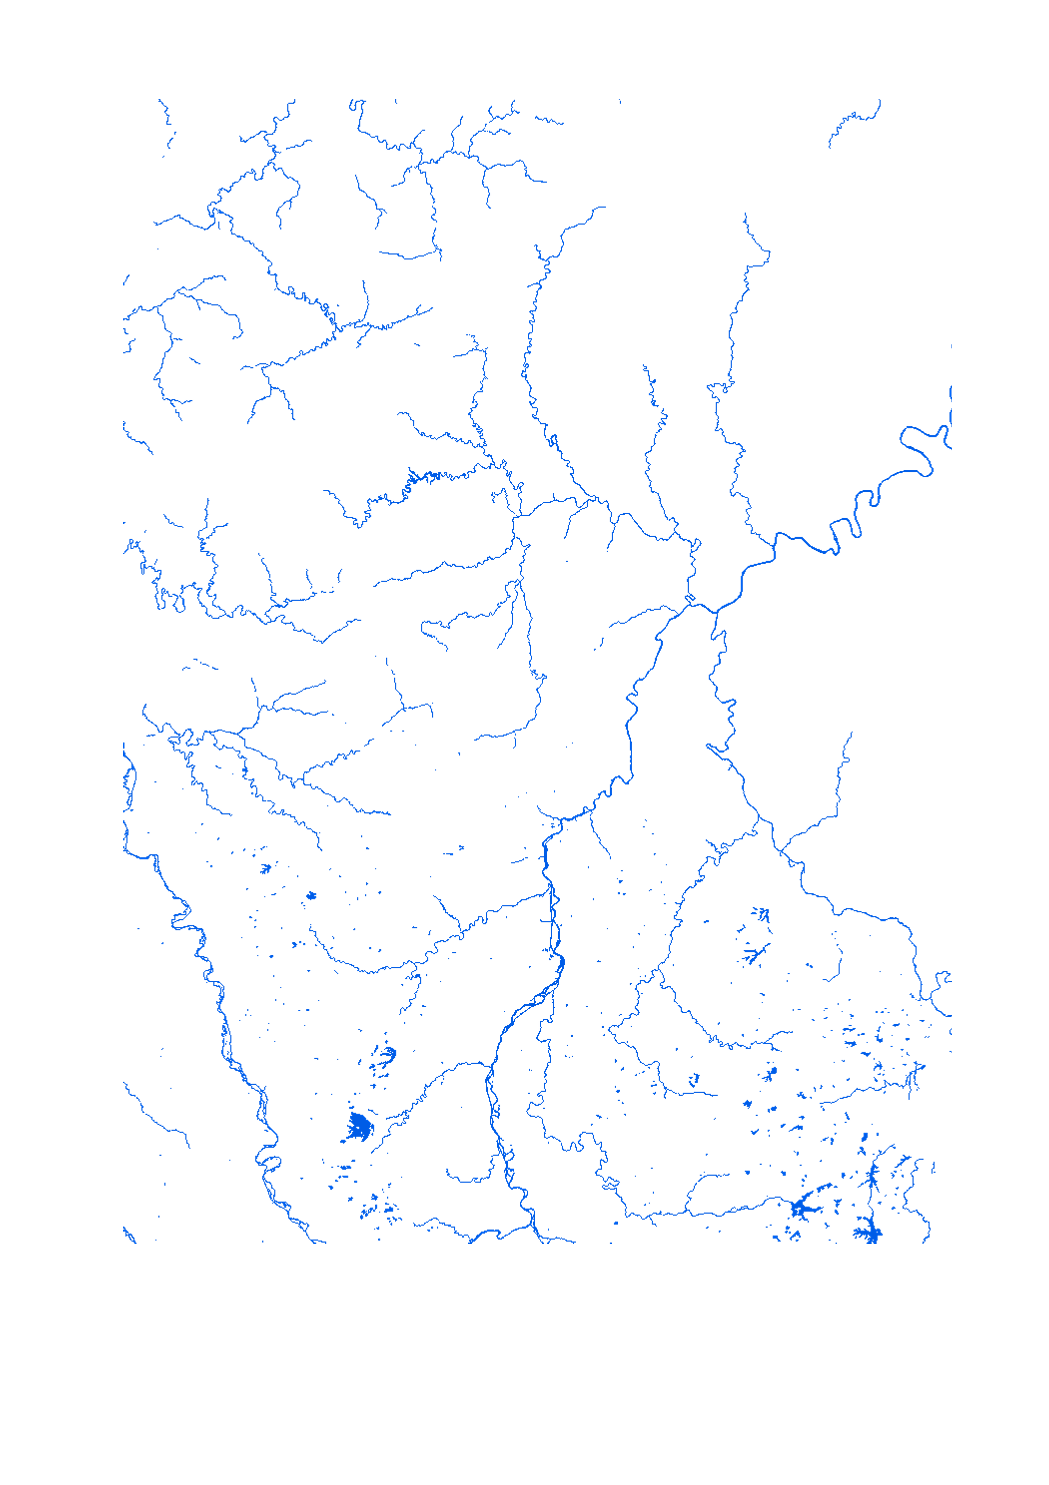
Final product of the b-solutions project GeoConnectGR - Harmonized geodata of the hydrographic network of the Greater Region (scale 1:25.000 - 1:50.000) - Sources: LVGL Saarland, LVermGeo Rheinland-Pfalz, NGI Belgium, IGN France, ACT Luxembourg - Harmonization: Federal Agency for Cartography and Geodesy (BKG) based on the data model Core Reference Data (CRD) developed by EuroGeographics - This data is published for non-commercial uses under the licence CC BY-NC 4.0: https://creativecommons.org/licenses/by-nc/3.0/legalcode
-
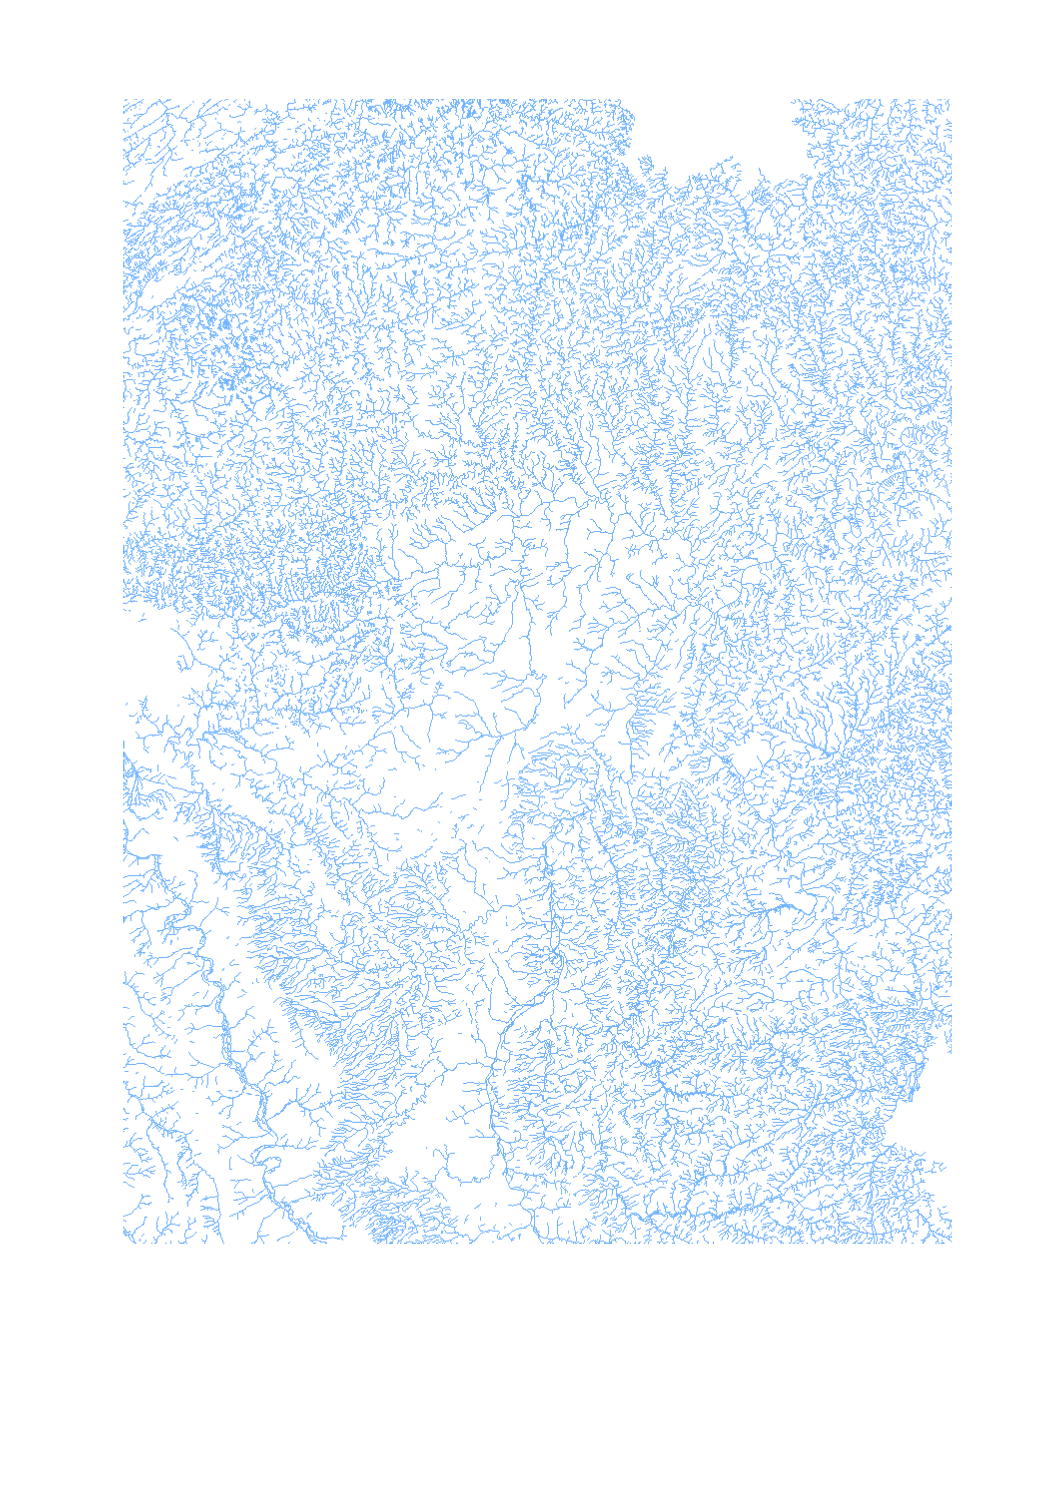
Final product of the b-solutions project GeoConnectGR: linear watercourses - Harmonized geodata of the hydrographic network of the Greater Region (scale 1:25.000 - 1:50.000) - Sources: LVGL Saarland, LVermGeo Rheinland-Pfalz, NGI Belgium, IGN France, ACT Luxembourg - Harmonization: Federal Agency for Cartography and Geodesy (BKG) based on the data model Core Reference Data (CRD) developed by EuroGeographics - This data is published for non-commercial uses under the licence CC BY-NC 4.0: https://creativecommons.org/licenses/by-nc/3.0/legalcode
-

- European air quality index (based on pollutant concentrations in µg/m3): hourly measurements for the pollutant PM2.5 for the most recent hour for each station - The sub-index PM2.5 is available according to the type of station (industrial, background or traffic) in accordance with the methodology for calculating the European air quality index for the measuring stations throughout the Greater Region. - Data depth: The most recent index for the last 3 hours for each station is available hourly. If the calculation of the sub-index is not possible due to lack of data, its value is marked by a grey dot in the symbology of the map (data not available). - Data sources: ATMO Grand Est; Agence Wallonne de l'Air et du Climat - AWAC; Landesamt für Umwelt- und Arbeitsschutz Saarland - IMMESA; Landesamt für Umwelt Rheinland-Pfalz - ZIMEN; Administration de l'environnement Luxembourg. Harmonization: ATMO Grand Est and GIS-GR 2020