 geocatalogue.geoportail.lu
asNeeded
Type of resources
Available actions
Topics
Keywords
Contact for the resource
Provided by
Groups
Years
Representation types
Update frequencies
status
Scale
-

Oct. 2012 - Temperature monthly average [ºC] lux_2012_10_map_temp_average,lux_2012_10_samples_temp_average The thematic maps presented here are published annually in the hydro-climatological Atlas of the Grand-Duchy of Luxembourg. The project is a collaboration between the Luxemburg Institute of Science and Technology (LIST), the Administration de la gestion de l’eau (AGE) and the Administration des services techniques de l’agriculture (ASTA). The maps show the spatial distribution and temporal evolution of air temperature and precipitation providing an overview of the meteorological situation in Luxembourg. The basis of this documentation is a dense and continuously operating measurement network throughout the country. For regions in which measurements are unavailable, values were estimated by means of spatial interpolation (Inverse Distance Weighting). The current precipitation patterns are compared with a climatic reference period (30 years).
-
The percentage of analysis in which the parameter nitrates meets the threshold value
-
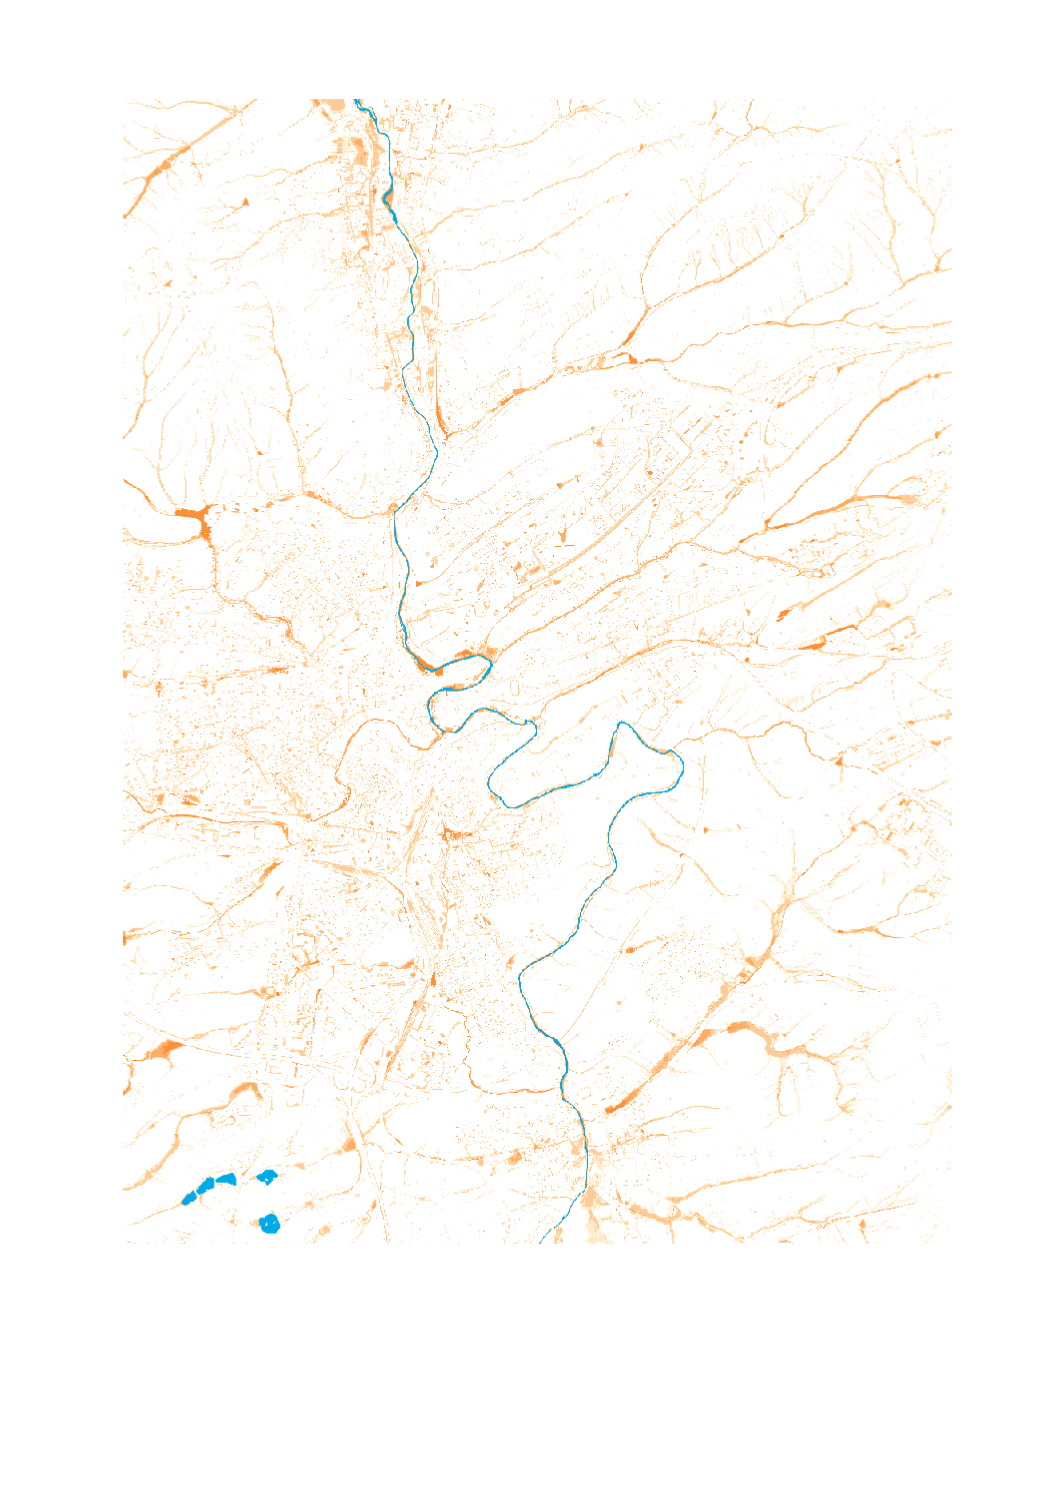
This map shows the extent and inundation depth of surface runoff in a 200-year heavy rainfall scenario [D60T200].
-

This map shows the extent and inundation depth of surface runoff in a 20-year heavy rainfall scenario [D60T20].
-
This layer contains an orthophoto with a ground resolution of 40 cm of the Grand Duchy of Luxembourg from 1994. It is based on a total of 600 scanned aerial images, which were georeferenced in a first step. The high-altitude aerial survey was carried out on 31 May 1994 at a scale of 1:30,000 by the Institut Géographique National - IGN-Creil SAA (France). The origin of the images is the archives of the Administration du Cadastre et de la Topographie (ACT) in Luxembourg. The orthophoto was calculated by the Division des Géomètres et de la Photogrammétrie (DGP) of the Administration des Ponts et Chaussées (Luxembourg Road Administration).
-
This layer contains the priority management zones.
-

-

Jun. 2013 - Precipitation, monthly sum [mm] lux_2013_06_map_pluvio_sum,lux_2013_06_samples_pluvio_sum The thematic maps presented here are published annually in the hydro-climatological Atlas of the Grand-Duchy of Luxembourg. The project is a collaboration between the Luxemburg Institute of Science and Technology (LIST), the Administration de la gestion de l’eau (AGE) and the Administration des services techniques de l’agriculture (ASTA). The maps show the spatial distribution and temporal evolution of air temperature and precipitation providing an overview of the meteorological situation in Luxembourg. The basis of this documentation is a dense and continuously operating measurement network throughout the country. For regions in which measurements are unavailable, values were estimated by means of spatial interpolation (Inverse Distance Weighting). The current precipitation patterns are compared with a climatic reference period (30 years).
-

Sep. 2013 - Average monthly maximum temperatures [ºC] lux_2013_09_map_temp_maximum,lux_2013_09_samples_temp_maximum The thematic maps presented here are published annually in the hydro-climatological Atlas of the Grand-Duchy of Luxembourg. The project is a collaboration between the Luxemburg Institute of Science and Technology (LIST), the Administration de la gestion de l’eau (AGE) and the Administration des services techniques de l’agriculture (ASTA). The maps show the spatial distribution and temporal evolution of air temperature and precipitation providing an overview of the meteorological situation in Luxembourg. The basis of this documentation is a dense and continuously operating measurement network throughout the country. For regions in which measurements are unavailable, values were estimated by means of spatial interpolation (Inverse Distance Weighting). The current precipitation patterns are compared with a climatic reference period (30 years).
-
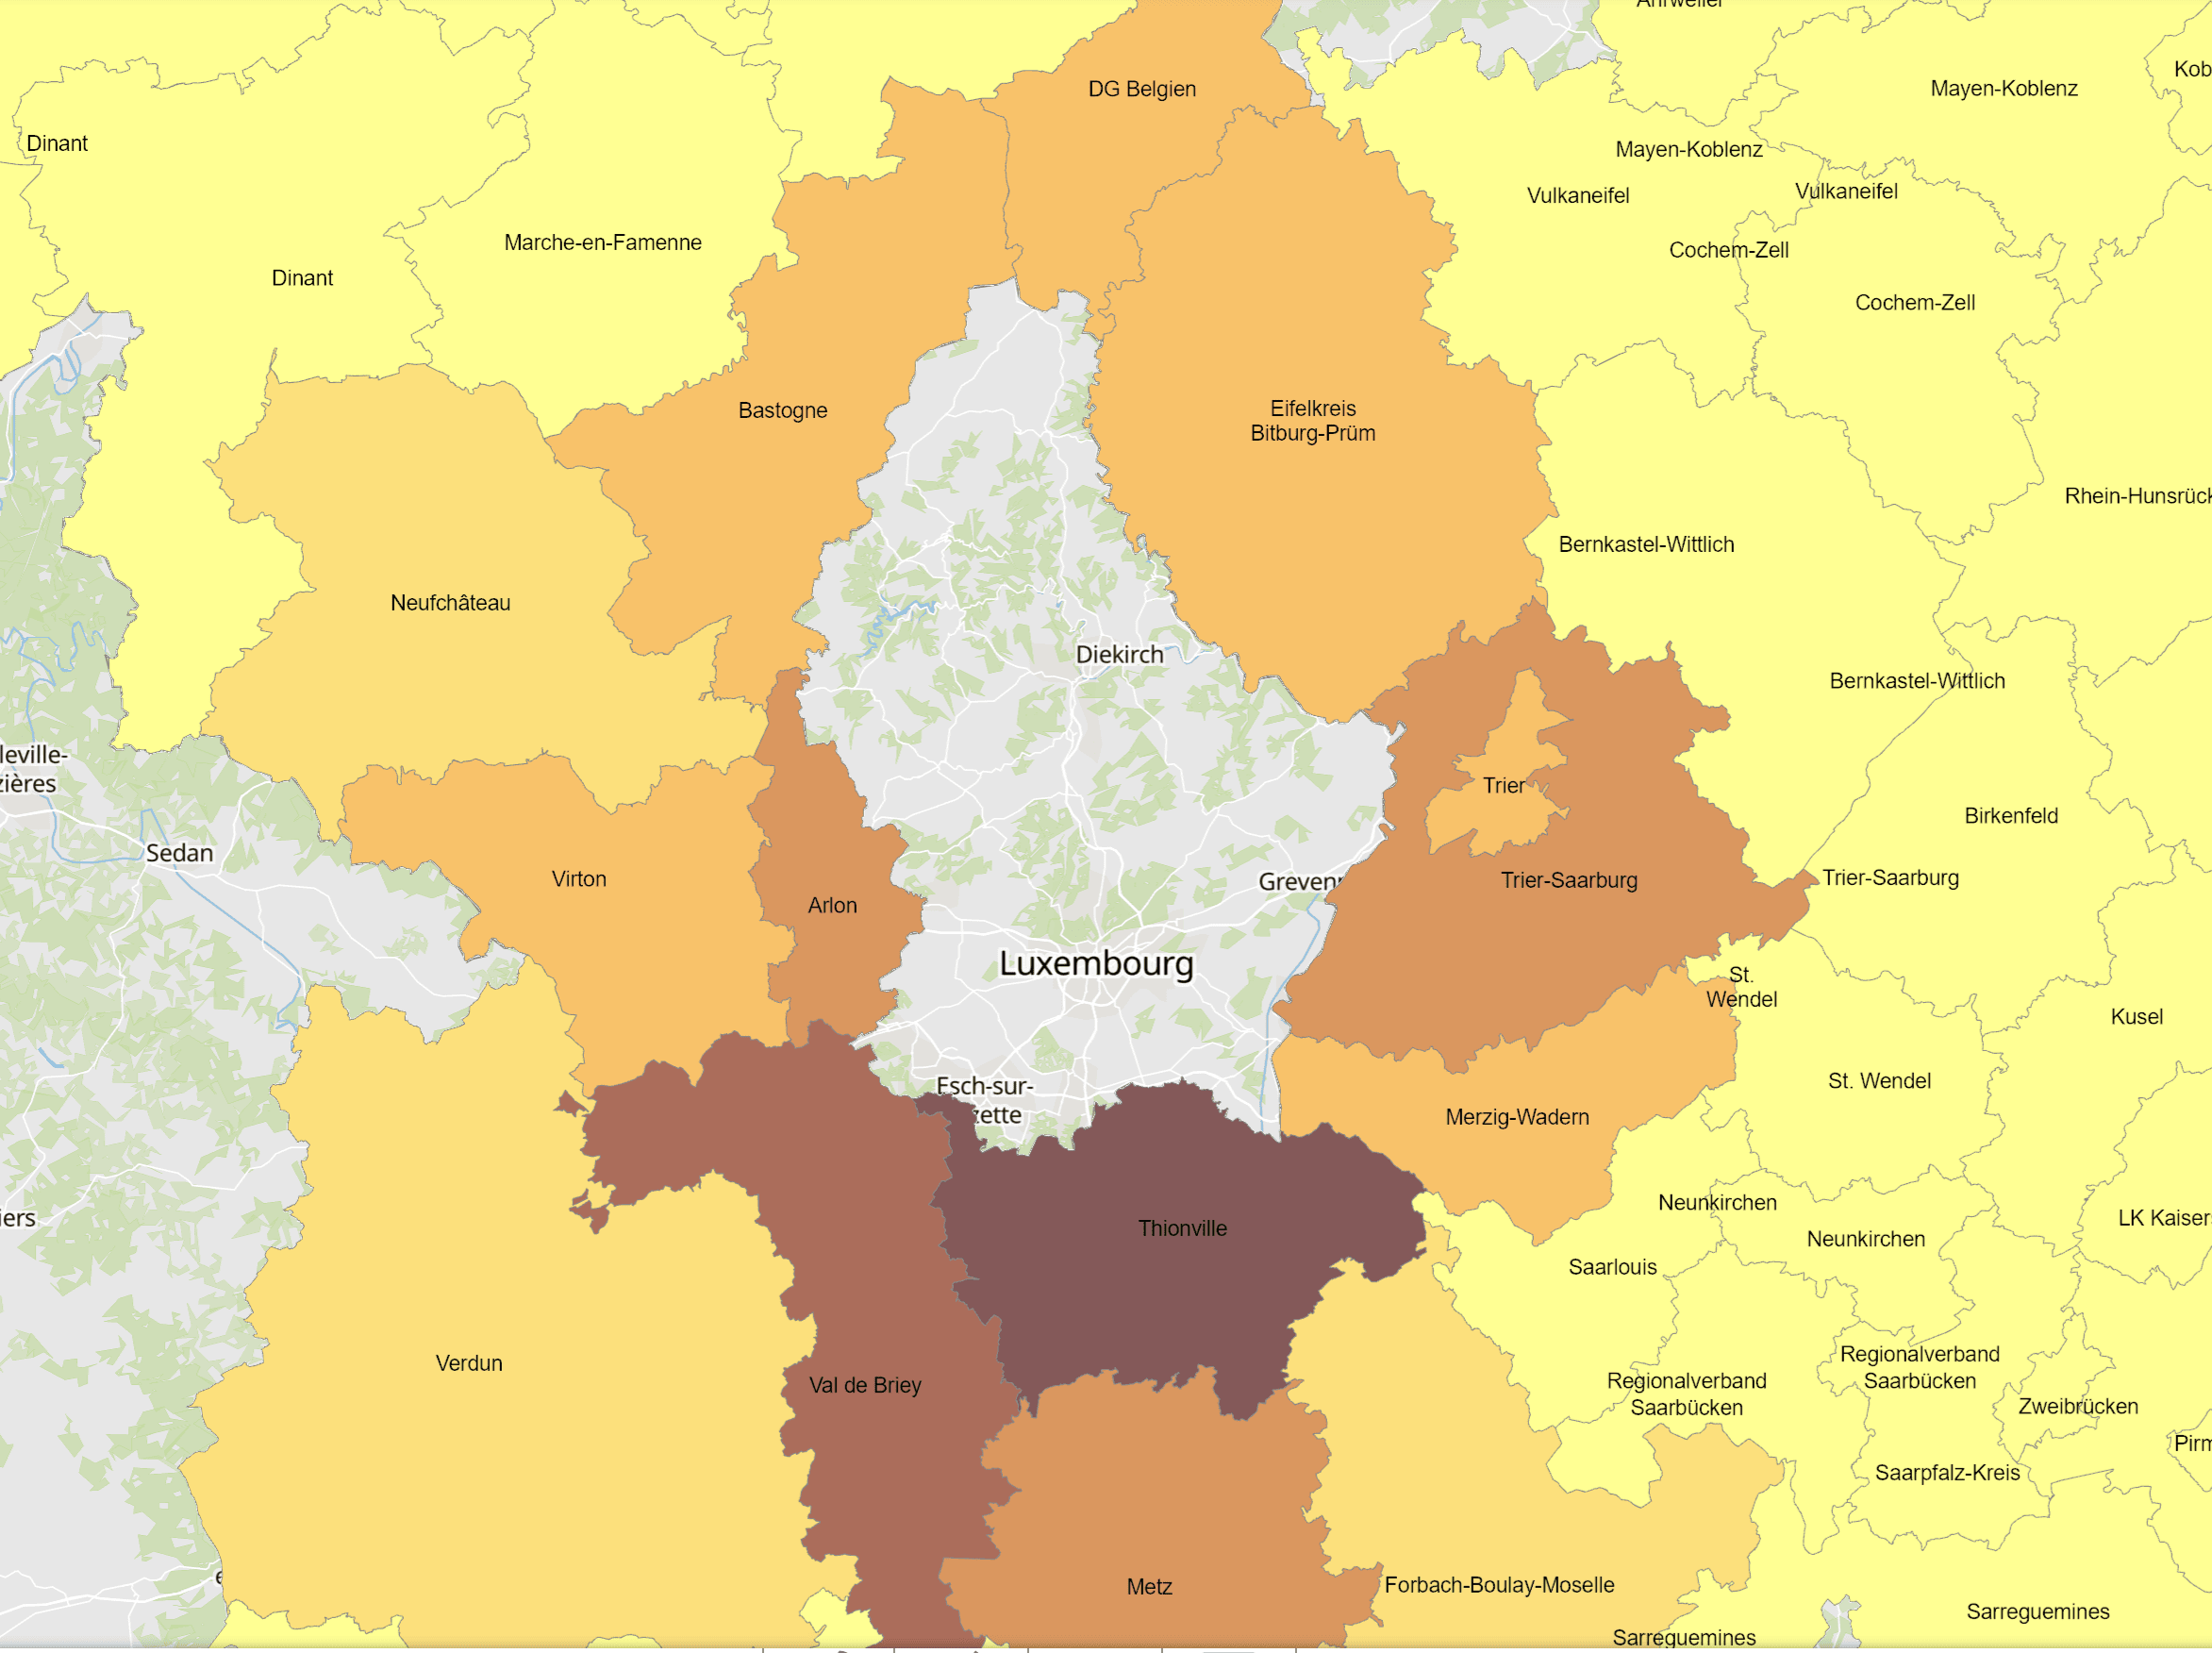
- Cross-border commuters to Luxembourg at place of residence in 2023 - Territorial entities: Kreise, arrondissements - Commuting data sources: IGSS. Calculations: OIE/IBA 2024 - Geodata sources: GeoBasis-DE / BKG, IGN France, NGI-Belgium. Harmonization: SIG-GR / GIS-GR 2024