 geocatalogue.geoportail.lu
continual
Type of resources
Available actions
Topics
Keywords
Contact for the resource
Provided by
Groups
Years
Representation types
Update frequencies
status
Scale
-
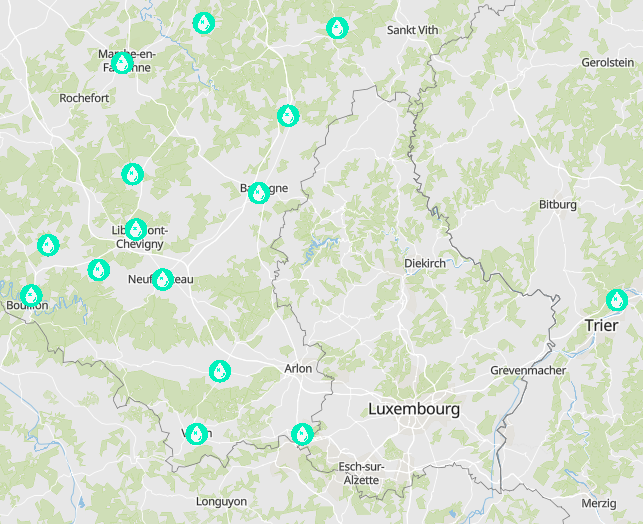
- INTER'RED project: specific means of intervention - Water supply and pumps - Data sources: Partners of the INTERREG V A project INTER'RED
-
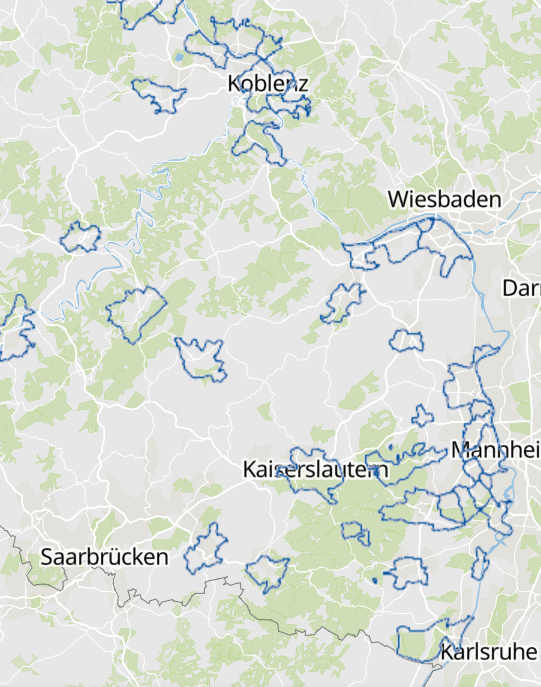
Delimitation of the verbandsfreie Städte und Gemeinde in Rhineland-Palatinate 2024 - Sources: © GeoBasis-DE / BKG 2017; IGN France 2017; NGI-Belgium 2017; ACT Luxembourg 2017; Region Grand Est; Statistisches Landesamt Rheinland-Pfalz, Statbel. Harmonization: SIG-GR / GIS-GR 2024
-
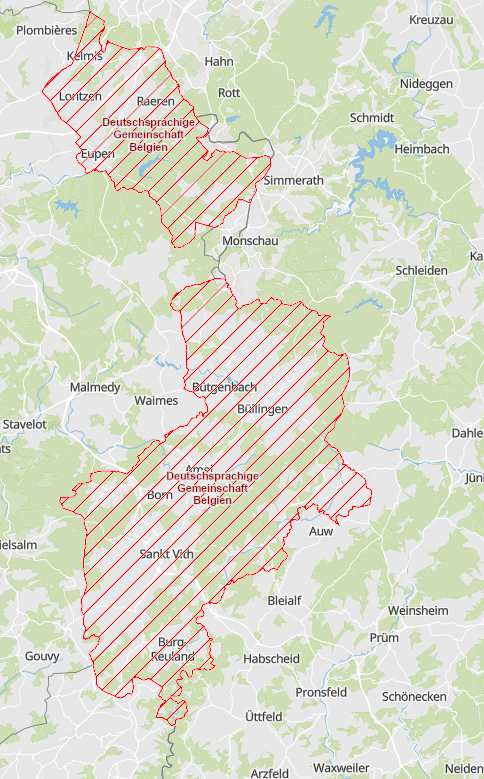
Delimitation of the German-speaking community of Belgium 2024 - Sources: © GeoBasis-DE / BKG 2017; IGN France 2017; NGI-Belgium 2017; ACT Luxembourg 2017; Region Grand Est; Statistisches Landesamt Rheinland-Pfalz, Statbel. Harmonization: SIG-GR / GIS-GR 2024
-
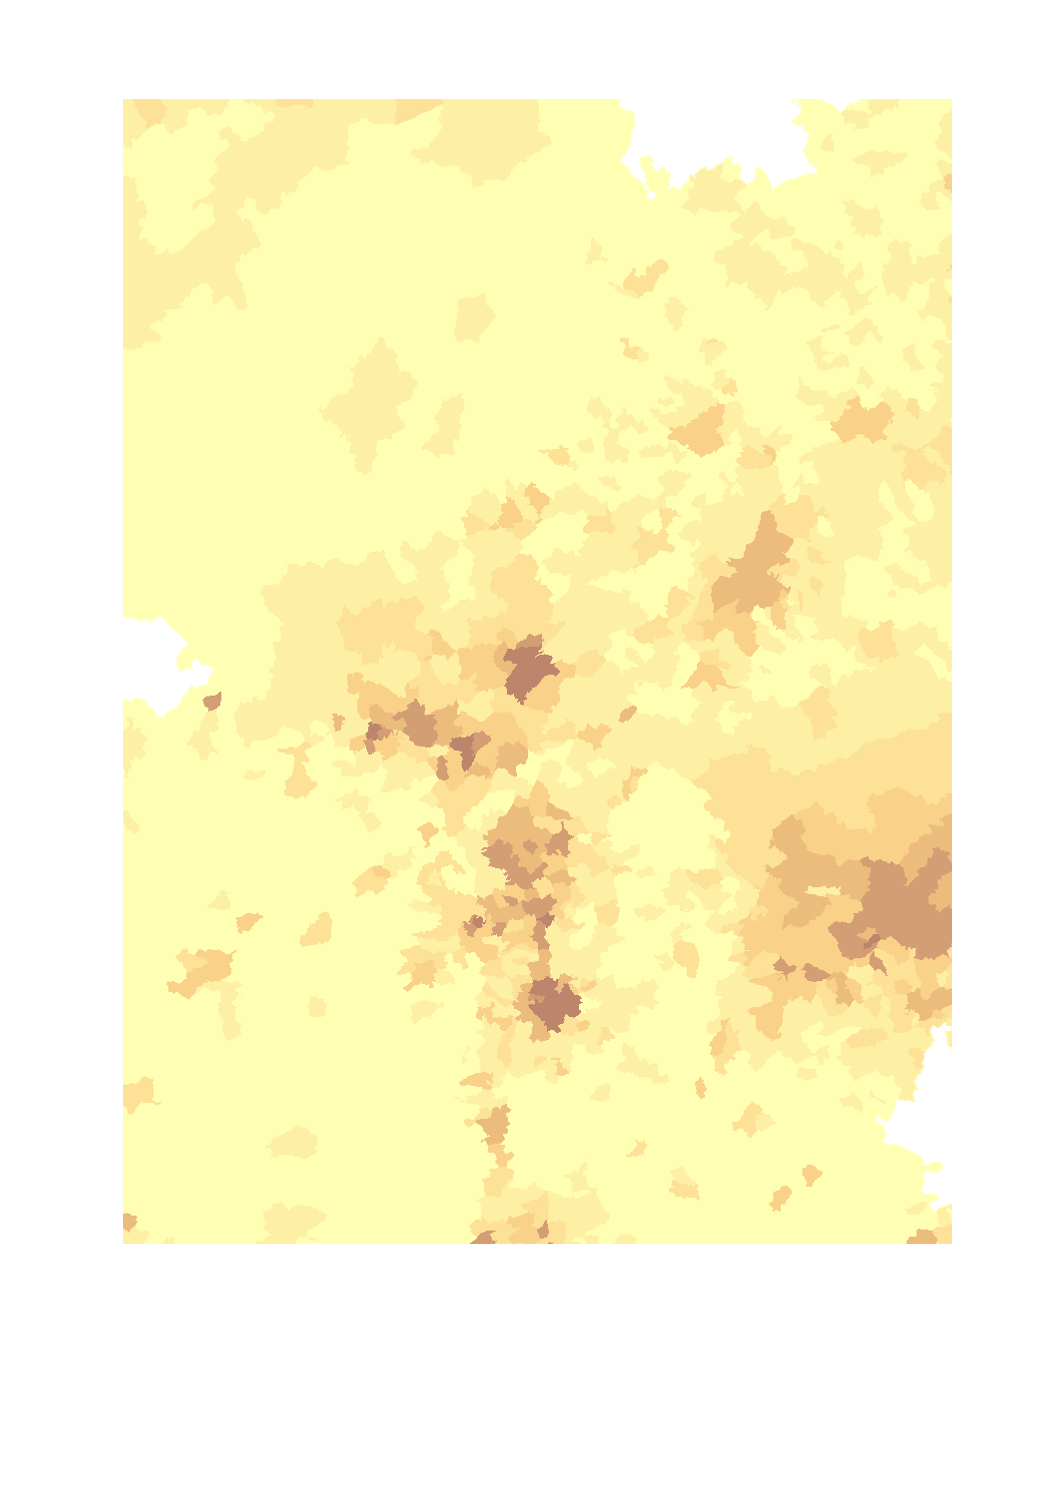
- Population density 2016 (inhabitants per km²) per municipality - Statistical data sources: INSEE Grand Est, IWEPS, Statistisches Landesamt Rheinland-Pfalz, Statistisches Amt Saarland, STATEC. Harmonization: LISER 2018 - Geodata sources: ACT Luxembourg 2017, IGN France 2017, GeoBasis-DE / BKG 2017, NGI-Belgium 2017. Harmonization: SIG-GR / GIS-GR 2018
-
- Number of nights spent and nights/population ratio in 2016 - Territorial level: NUTS 2 - Sources: Eurostat - European Commission 2016, EuroGeographics 2013. Harmonization: Lepur - ULiège
-
Share of road traffic accidents involving injury with young car drivers (aged 18-24 years) 2018-2022 - Source: Sub-Working Group on Road Safety of the Summit of the Greater Region 2023 - Base map: © ACT Luxembourg 2017, IGN France 2017, GeoBasis-DE / BKG 2017, NGI-Belgium 2017
-
Population (%) aged 30-34 with tertiary educational attainment in 2019 - Territorial entities: NUTS 2 - Data source: European Commission, Eurostat/GISCO 2021. Harmonization: GIS-GR 2022
-
Share (%) of GDP going to Research and Development (R&D) in 2020 (Belgium: 2017, Germany :2019) - Territorial entities: NUTS 2 - Data source: European Commission Eurostat/GISCO 2023. Harmonization: SIG-GR/GISGR 2023
-
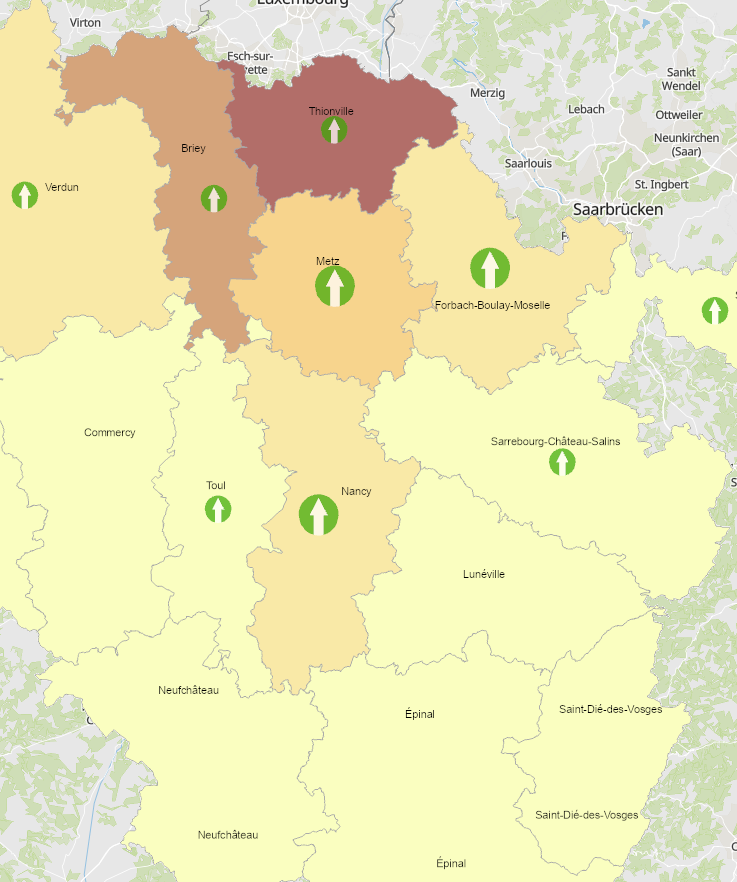
- Cross-border commuters from Lorraine to Luxembourg at place of residence (arrondissements): 2011-2021 - Territorial entities: arrondissements - Commuting data sources: IGSS 2022. Calculations: OIE/IBA 2022 - Geodata sources: IGN France. Harmonization: SIG-GR / GIS-GR 2022
-
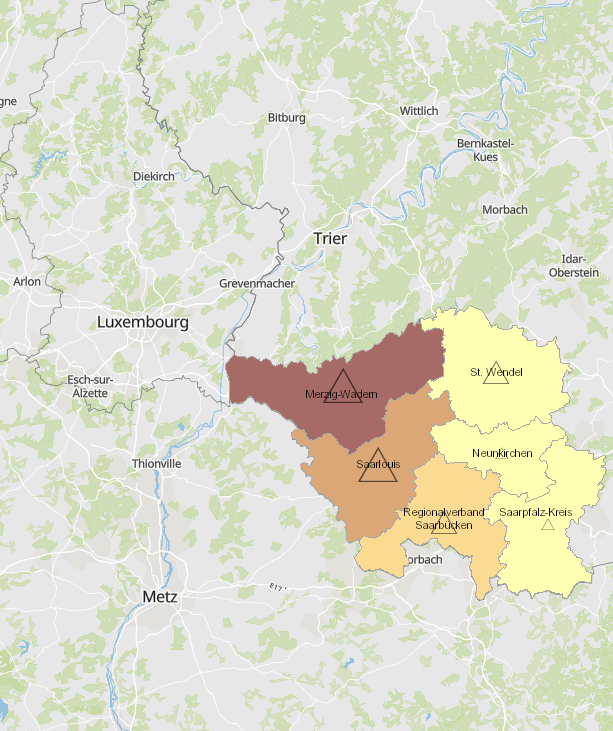
- Cross-border commuters from Saarland to Luxembourg at place of residence (Kreise): 2011-2019 - Territorial entities: Landkreise - Commuting data sources: IGSS 2020. Calculations: OIE/IBA 2020 - Geodata sources: GeoBasis-DE / BKG 2017. Harmonization: SIG-GR / GIS-GR 2020