 geocatalogue.geoportail.lu
Administration de la gestion de l'eau
Type of resources
Available actions
Topics
Keywords
Contact for the resource
Provided by
Groups
Years
Representation types
Update frequencies
status
Scale
-
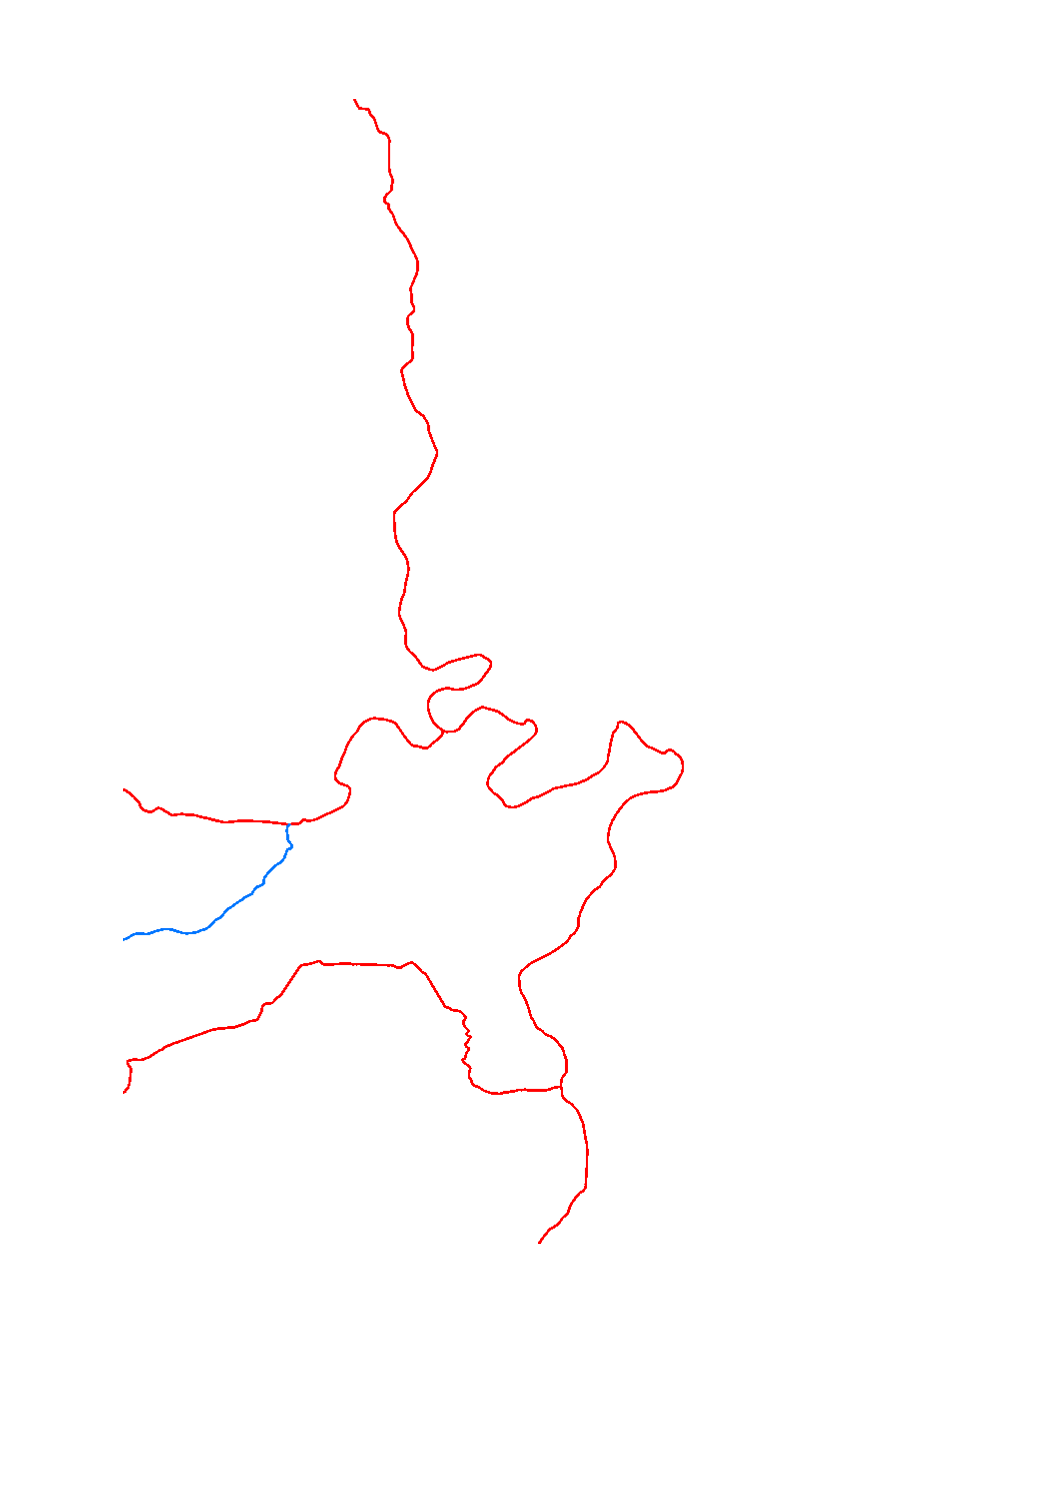
All natural water expanses and basins.
-
scenario of the flood risk map which shows the floodplain of a modeled 100-year flood event, as demanded by the floods directive 2007/60/EC
-
Status of the water bodies 2009
-
Status of the authorization demands.
-

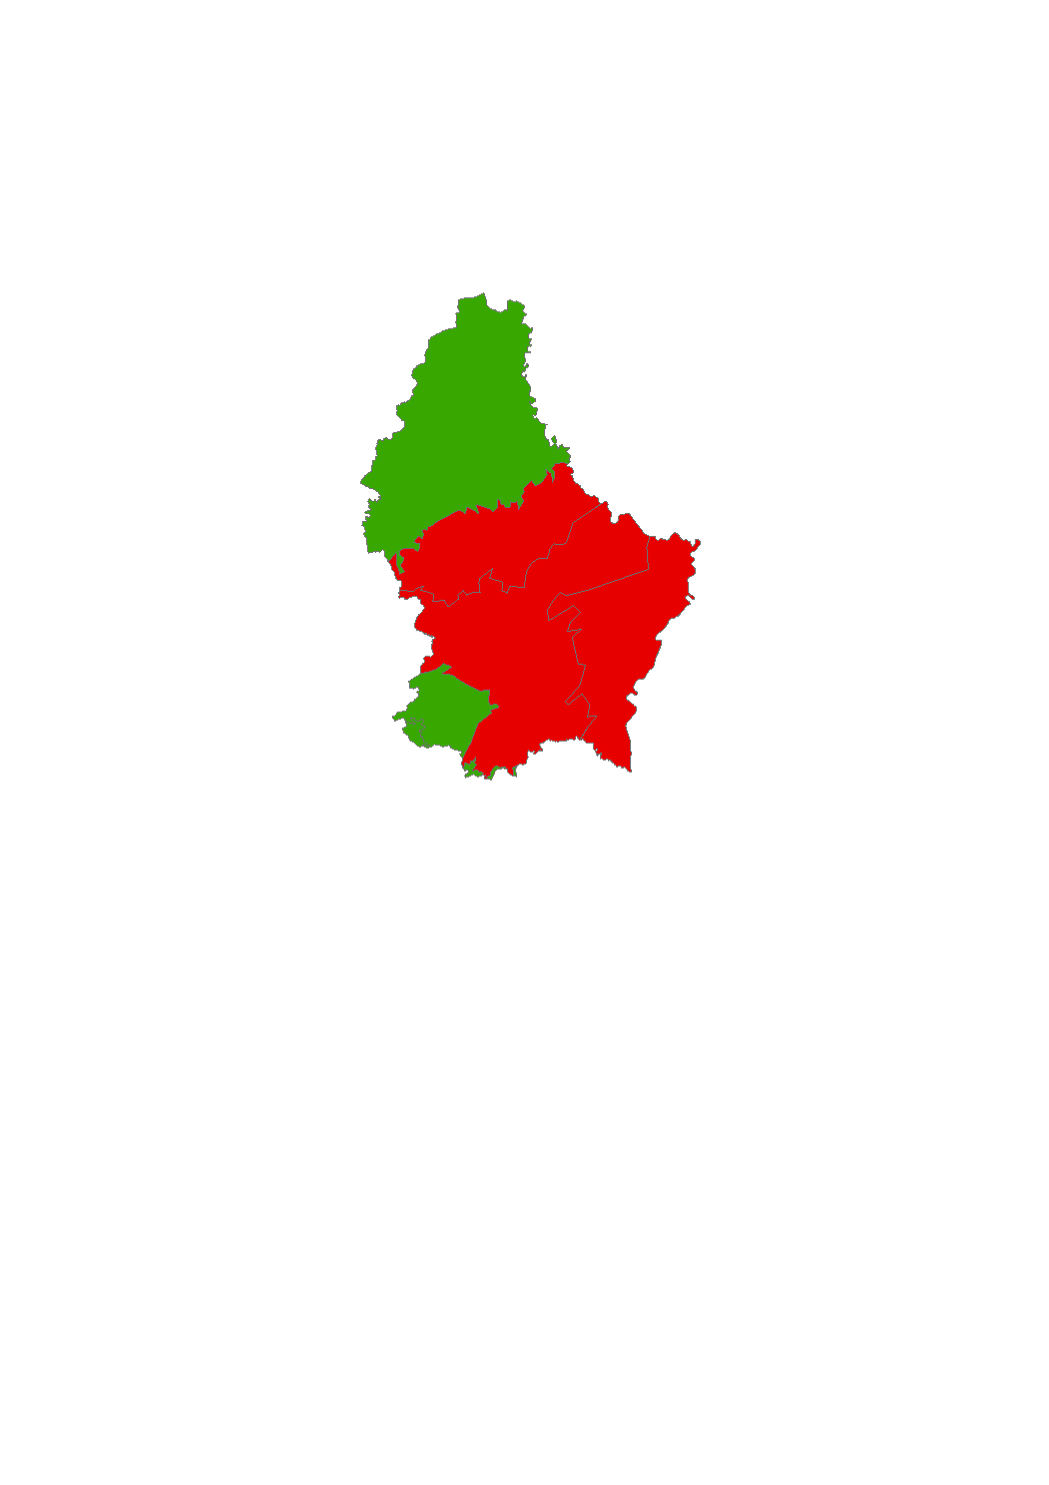
The chemical status of the surface water bodies is assessed as being good or failing to achieve good chemical status. The assessment of the chemical status for the third river basin management plan is based on the list of substances of directive 2008/105/EC and the environmental quality standards established by the new directive 2013/39/EC.
-
The chemical status of the surface water bodies is assessed as being good or failing to achieve good chemical status. The assessment of the chemical status for the third river basin management plan is based on the list of substances of directive 2008/105/EC and the environmental quality standards established by the new directive 2013/39/EC. The assessment without the ubiquist substances permits to get a differentiated picture of the actual situation.
-

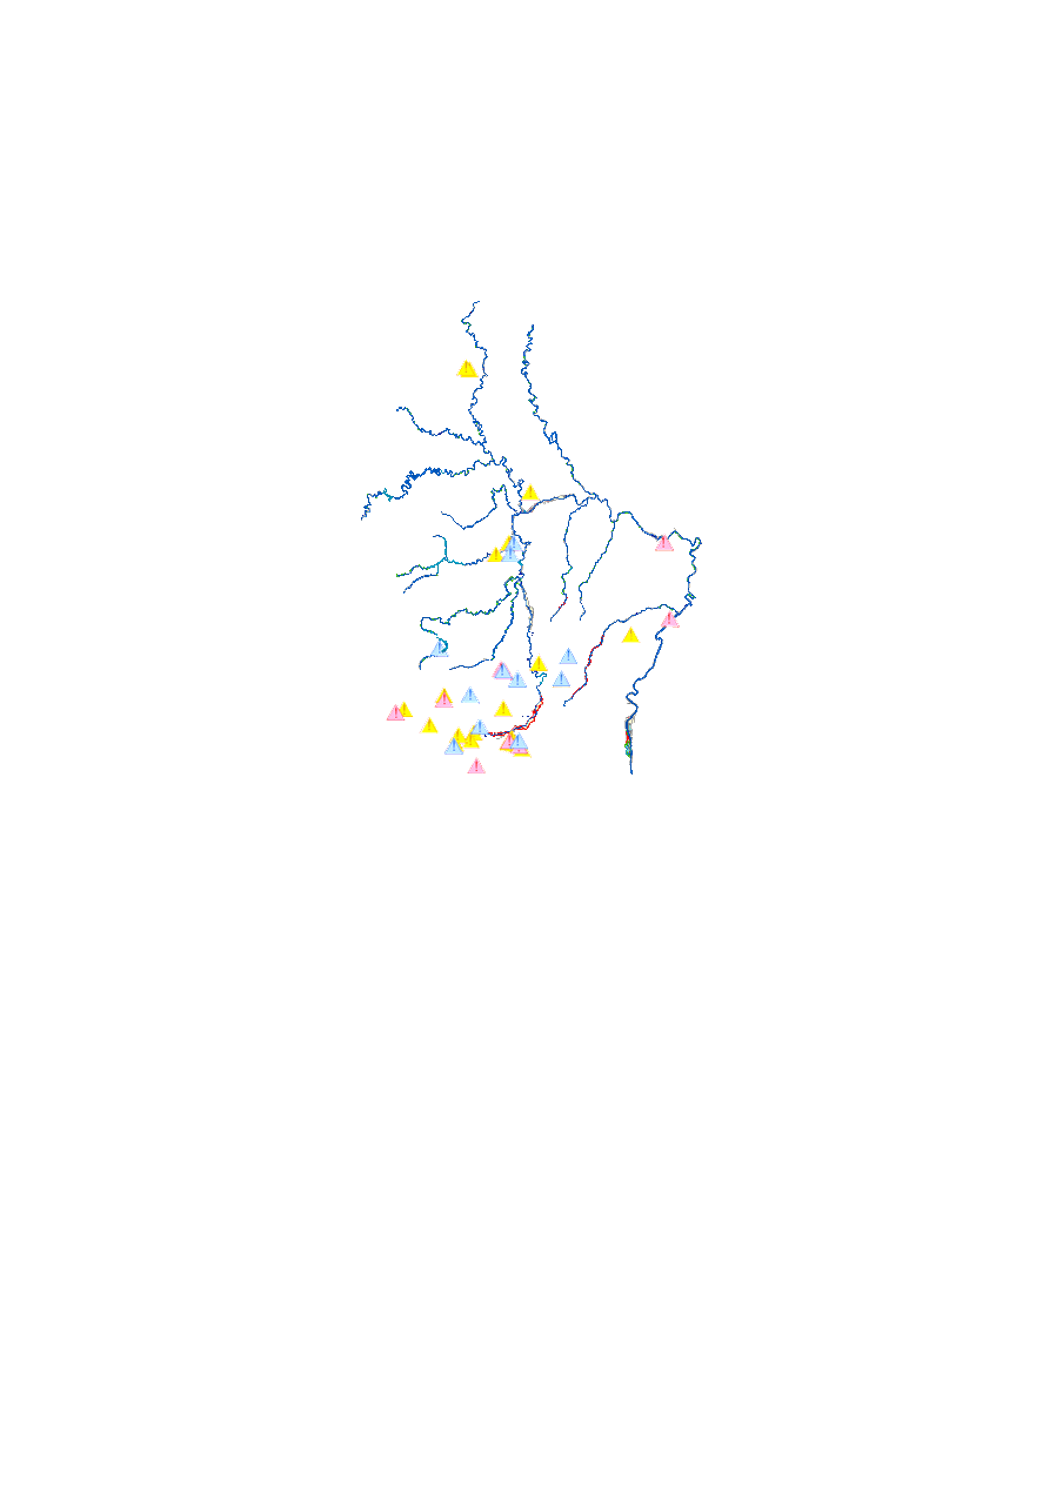
Phytoplancon is one of the 4 biological quality elements (BQE) used for the assessment of the ecological status of the surface water bodies. The assessment is made in 5 classes : high (blue) - good (green) - moderate (yellow) - poor (orange) - bad (red). The evaluation of this BQE is only relevant for the large rivers where the quantity of phytoplancton is significant and can be evaluated. Therefore phytoplancton is assessed in natural water bodies of type VI an in heavy modified waterbodies (HMWB) presenting a lake character, as the HMWB Sûre (WB III-2.2.1) and the HMWB Our (WB V-1.2). The frequency for phytoplancton monitoring is annually with 6 samples between April and October.
-
Surface water quality monitoring network for the period 2015-2020 regarding the water framework directive (2000/60/CE). The results of this monitoring are used for assessing the surface water body status in relation to the 3rd river basin managament plan. The stations for the global physico-chemical status are the same as those used for the chemical status but not necessarily the same as those used for the biological status.
-

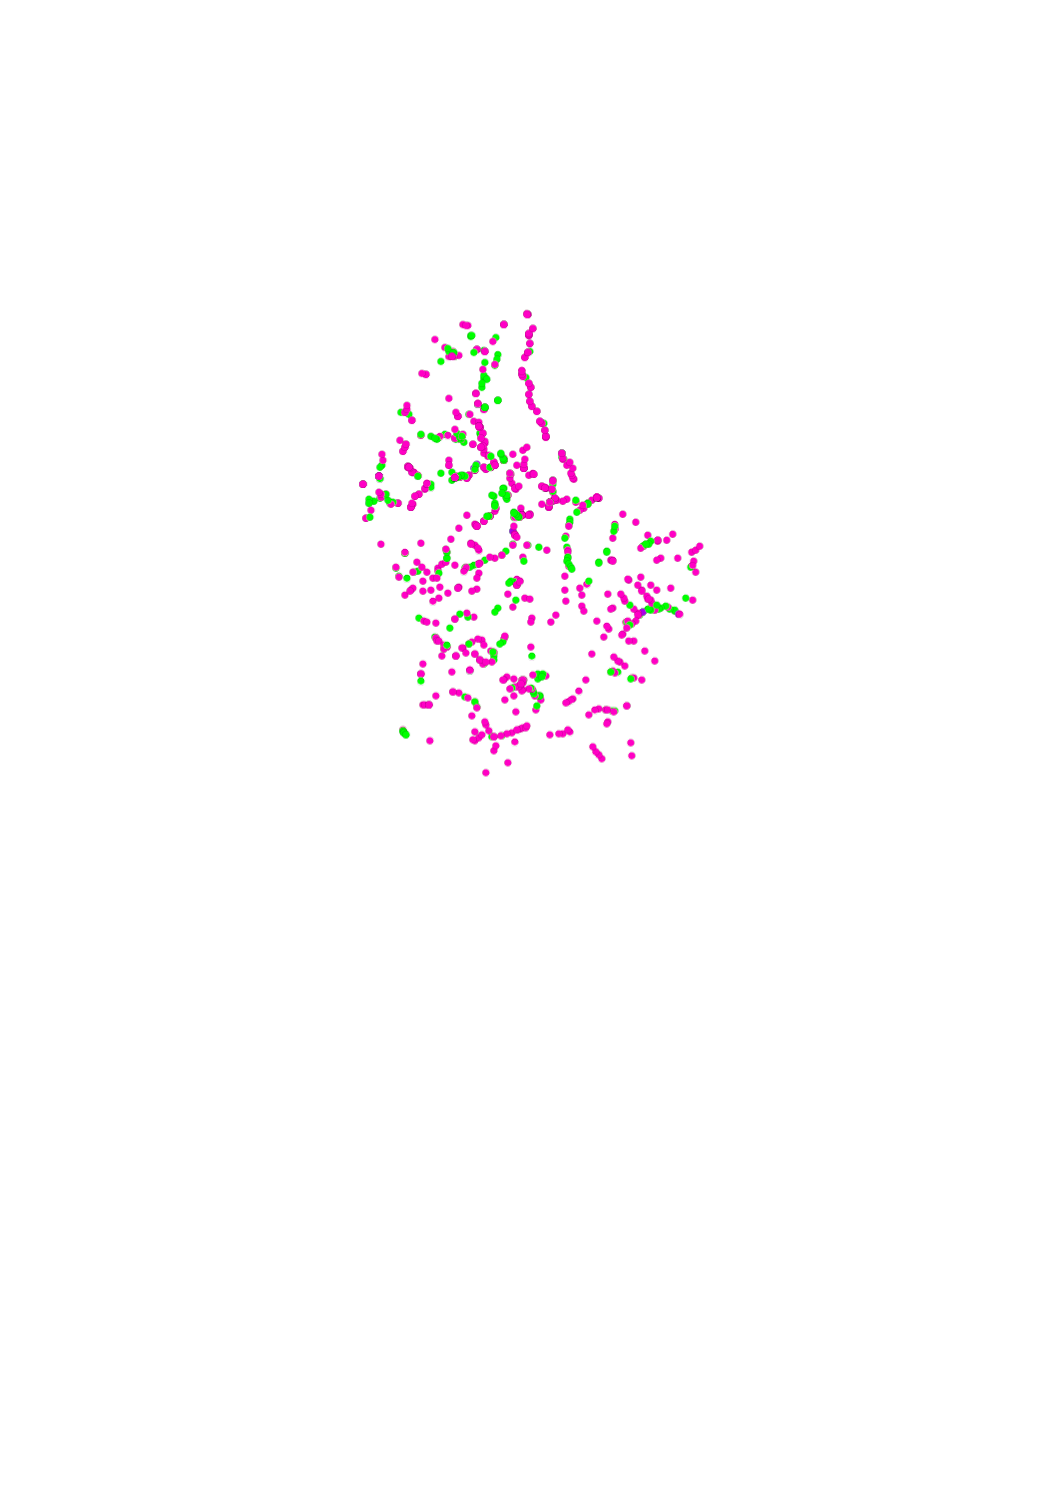
The overall evaluation of the biological status per surface water body is based on the evaluation of the biological quality elements (BQE) : phytoplantcon, aquatic flora, macroinvertebrates an fish. In order to determine the overall evaluation of the biological status per surface water body the worst status assessed by the different biological quality elements ist retained („One out - all out“ principle).
-

Macrophytes and phytobenthos (diatoms) are two sub-elements of the biological quality element (BQE) of the aquatic flora used for the assessment of the ecological status/potential. The assessment of the aquatic flora is made in 5 classes : high (blue) - good (green) - moderate (yellow) - poor (orange) - bad (red). The aquatic flora ist assessed following the sub-element the less good (worst-case).