0
Type of resources
Available actions
Topics
Keywords
Contact for the resource
Provided by
Groups
Years
Representation types
Update frequencies
status
Scale
-

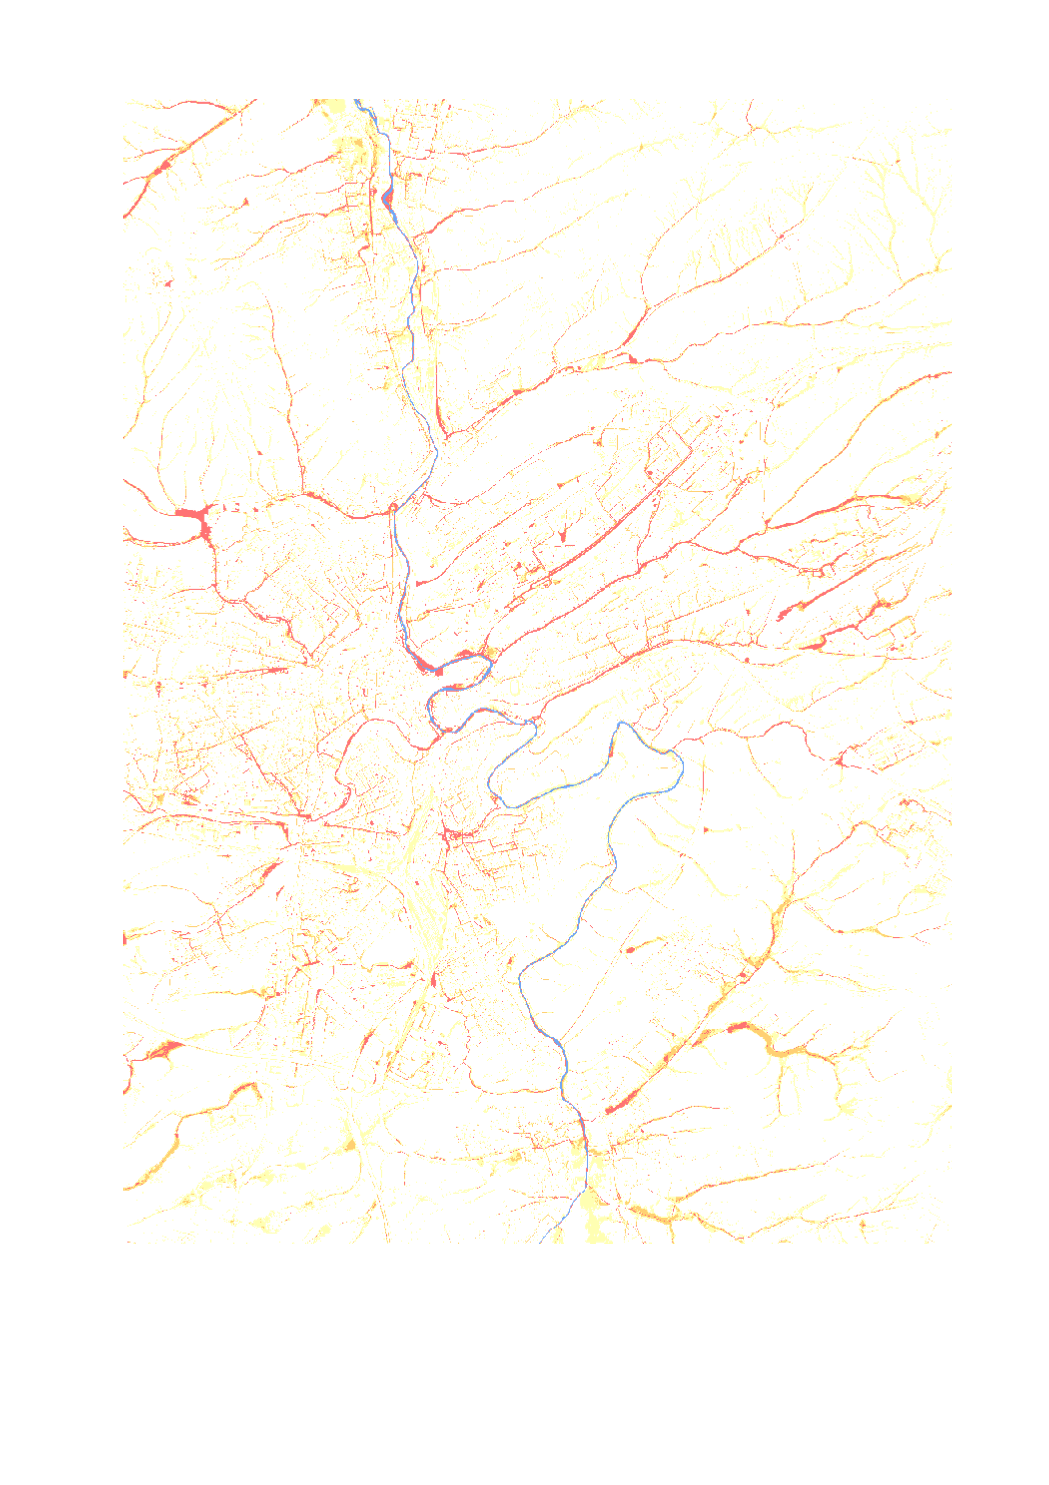
This map shows the flashfloods in a heavy rainfall scenario [Duration 60 - annuality 100years]. This hazard matrix is created by intersecting flow velocity and flooding depth, the hazard matrix shows the degree of hazard to be expected at the potential sites. Flood depths from 4 cm and flow velocities from 0.2 m/s are displayed.
-
The percentage of analysis in which the parameter enterococci meets the threshold value
-
The percentage of analysis in which the parameter clostridium perfringens meets the threshold value
-

This map shows the extent and inundation depth of surface runoff in a 20-year heavy rainfall scenario [D60T20].
-
The percentage of analysis in which the parameter nitrates meets the threshold value
-
The percentage of analysis in which the parameter polycyclic aromatic hydrocarbons meets the threshold value
-
The percentage of analysis in which the parameters of group A (analysis count) meet the threshold value
-

The WFD's quantitative status objectives aim to ensure a balance between groundwater withdrawal and recharge.
-

Watercourses with a significant risk of flooding
-

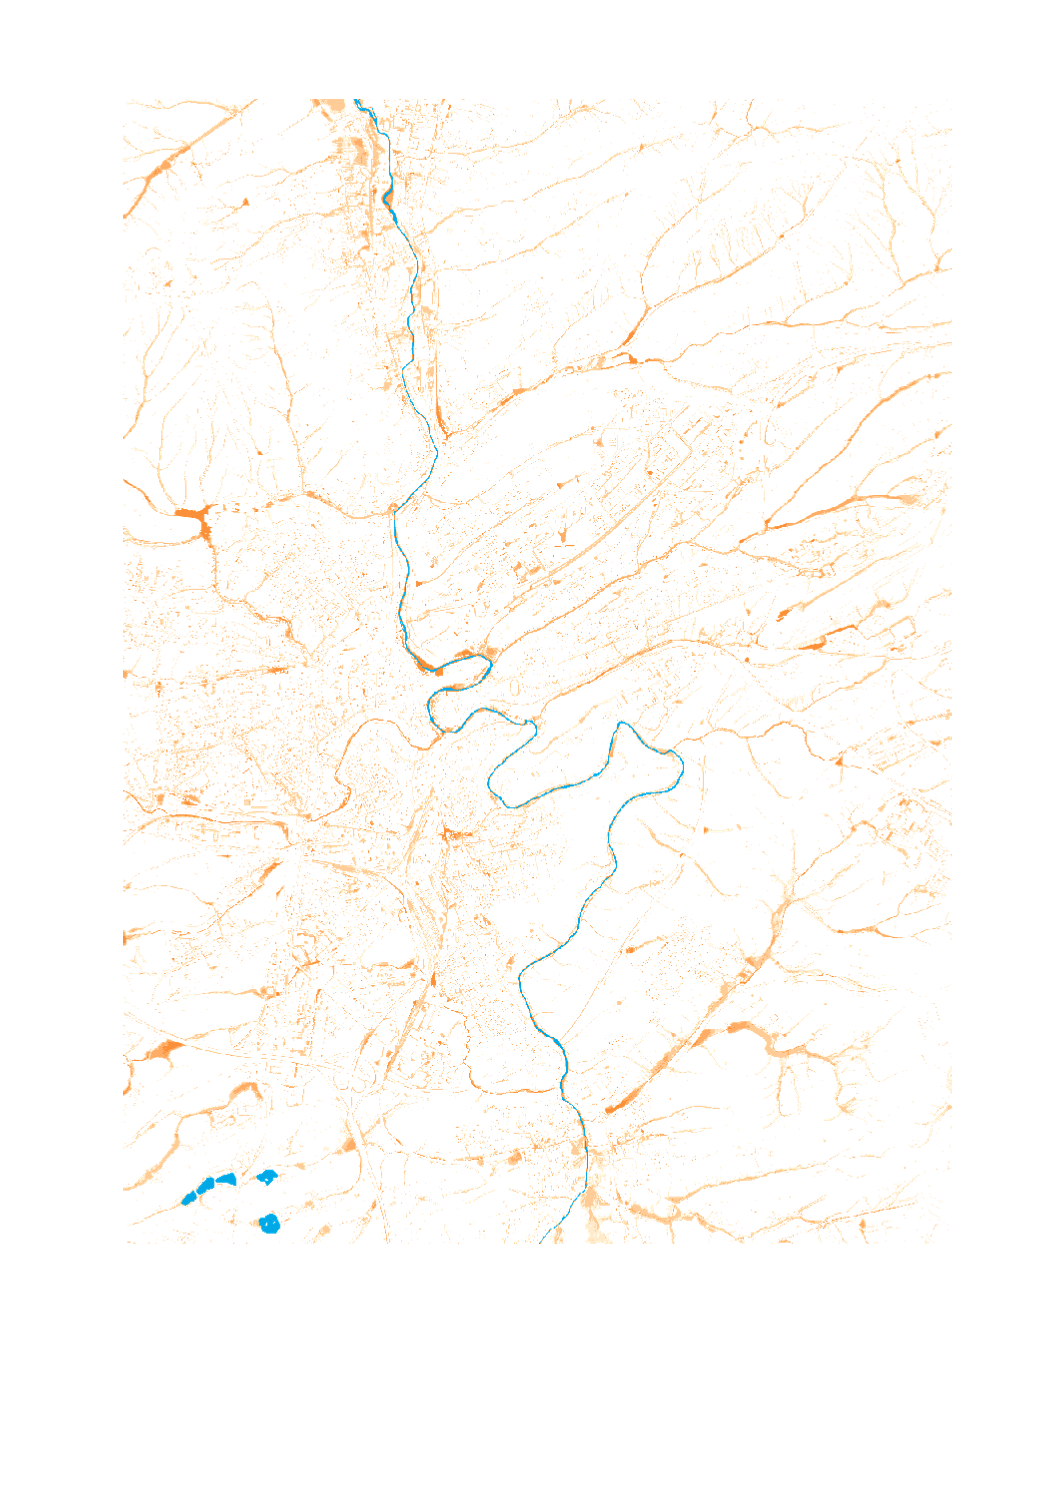
This map shows the extent and inundation depth of surface runoff in a 100-year heavy rainfall scenario [D60T100].
 geocatalogue.geoportail.lu