 geocatalogue.geoportail.lu
Type of resources
Available actions
Topics
Keywords
Contact for the resource
Provided by
Groups
Years
Representation types
Update frequencies
status
Service types
Scale
-
The percentage of analysis in which the parameter polycyclic aromatic hydrocarbons meets the threshold value
-
The percentage of analysis in which the parameter pesicides sum meets the threshold value
-
-
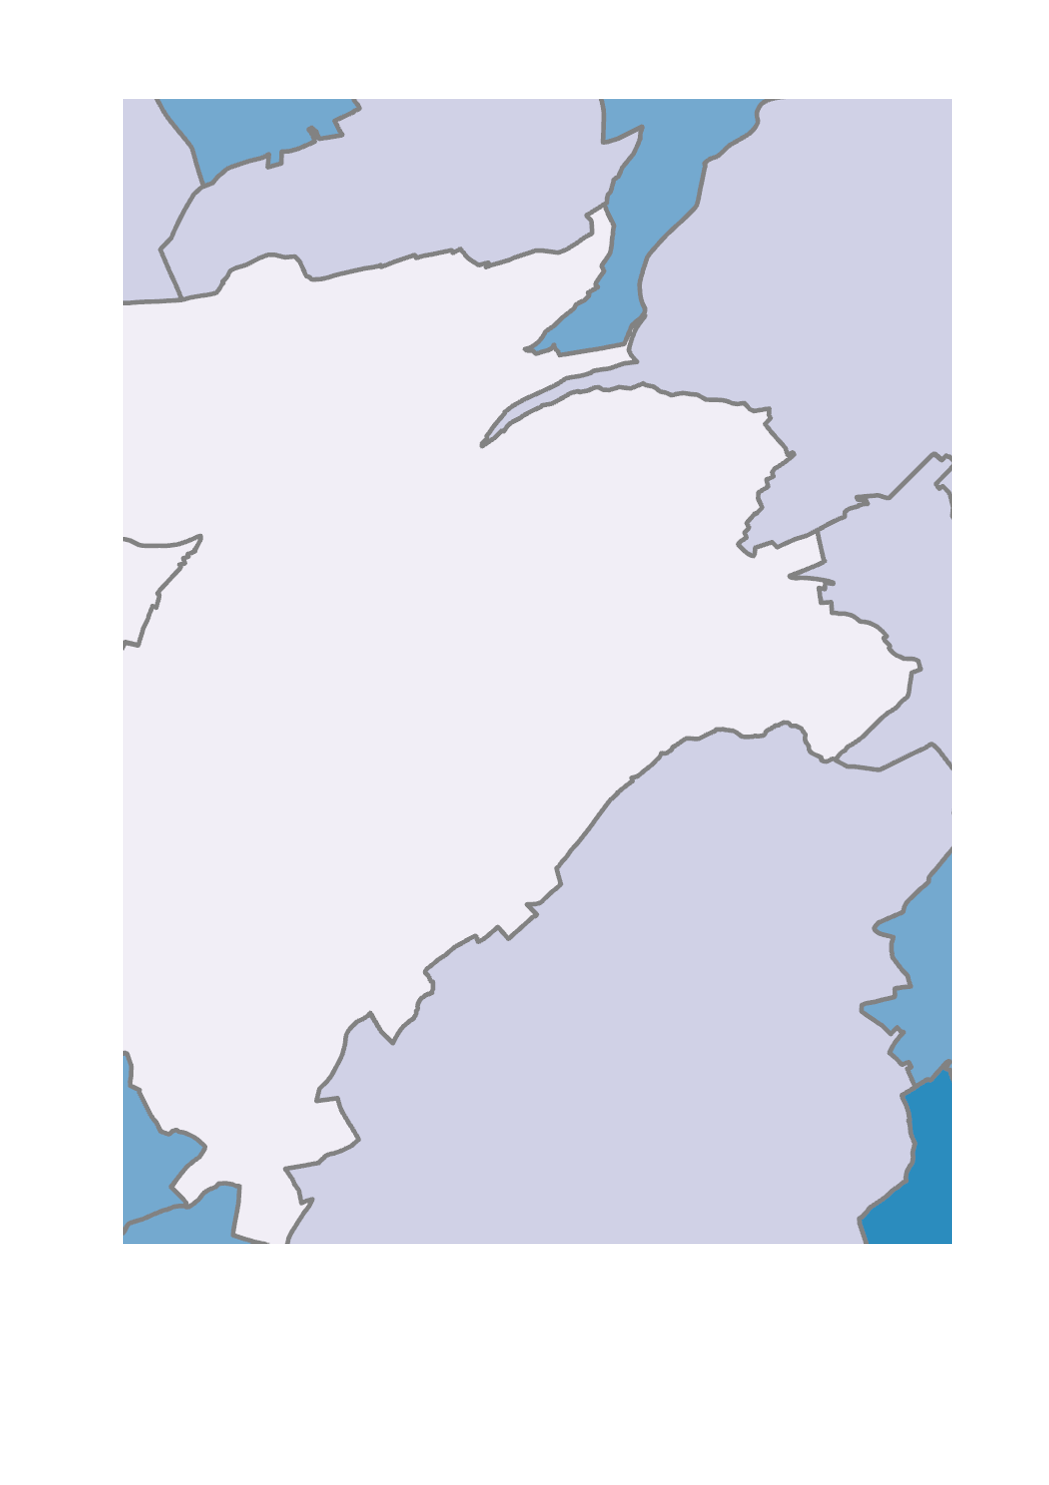
This layer shows the share of the municipal population whose main language is Luxembourgish recorded during the population census of the 8th of November 2021. For more information, please see the following publication: https://statistiques.public.lu/en/recensement/diversite-linguistique.html
-

Oct. 2012 - Precipitation, monthly difference to reference period [mm] lux_2012_10_map_pluvio_diff_mm,lux_2012_10_samples_pluvio_diff_mm The thematic maps presented here are published annually in the hydro-climatological Atlas of the Grand-Duchy of Luxembourg. The project is a collaboration between the Luxemburg Institute of Science and Technology (LIST), the Administration de la gestion de l’eau (AGE) and the Administration des services techniques de l’agriculture (ASTA). The maps show the spatial distribution and temporal evolution of air temperature and precipitation providing an overview of the meteorological situation in Luxembourg. The basis of this documentation is a dense and continuously operating measurement network throughout the country. For regions in which measurements are unavailable, values were estimated by means of spatial interpolation (Inverse Distance Weighting). The current precipitation patterns are compared with a climatic reference period (30 years).
-

Jul. 2013 - Average monthly minimum temperatures [ºC] lux_2013_07_map_temp_minimum,lux_2013_07_samples_temp_minimum The thematic maps presented here are published annually in the hydro-climatological Atlas of the Grand-Duchy of Luxembourg. The project is a collaboration between the Luxemburg Institute of Science and Technology (LIST), the Administration de la gestion de l’eau (AGE) and the Administration des services techniques de l’agriculture (ASTA). The maps show the spatial distribution and temporal evolution of air temperature and precipitation providing an overview of the meteorological situation in Luxembourg. The basis of this documentation is a dense and continuously operating measurement network throughout the country. For regions in which measurements are unavailable, values were estimated by means of spatial interpolation (Inverse Distance Weighting). The current precipitation patterns are compared with a climatic reference period (30 years).
-
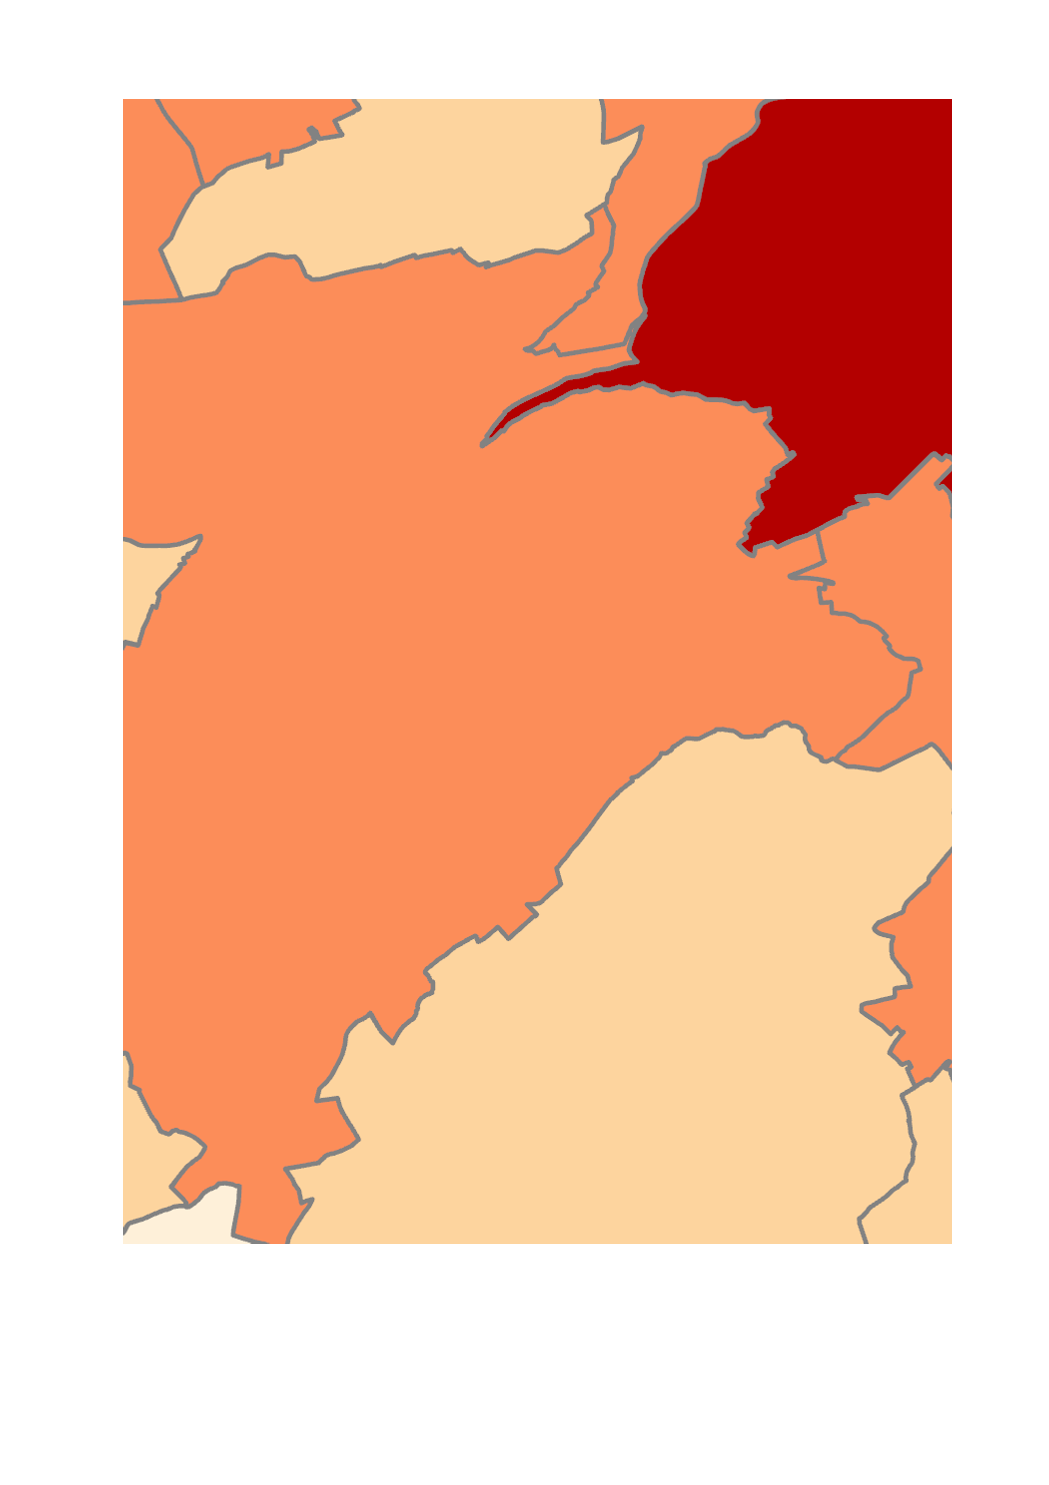
This layer shows the share of the municipal population whose main language is German recorded during the population census of the 8th of November 2021. For more information, please see the following publication: https://statistiques.public.lu/en/recensement/diversite-linguistique.html
-
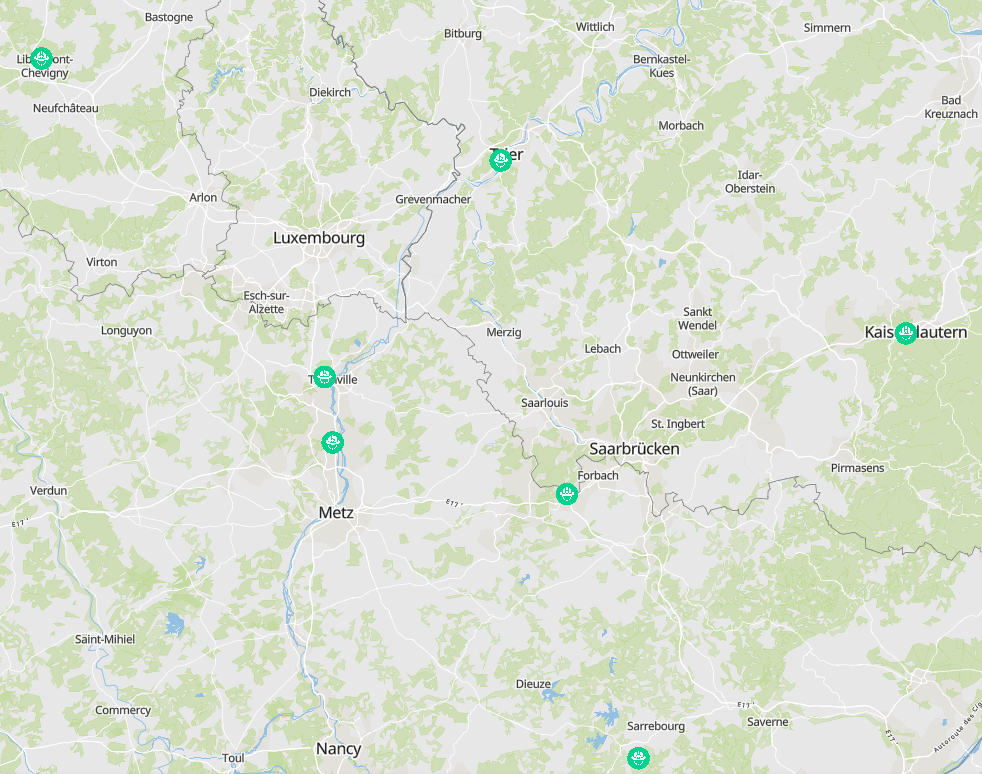
- INTER'RED project: specific means of intervention - Head of operations - Data sources: Partners of the INTERREG V A project INTER'RED
-
- INTER'RED project: specific means of intervention - Technical assistance - Data sources: Partners of the INTERREG V A project INTER'RED
-
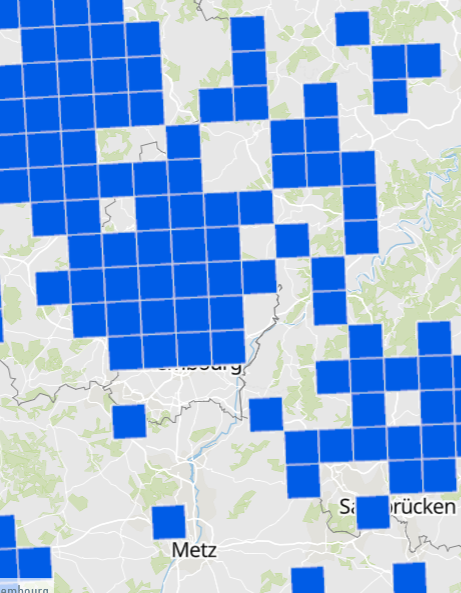
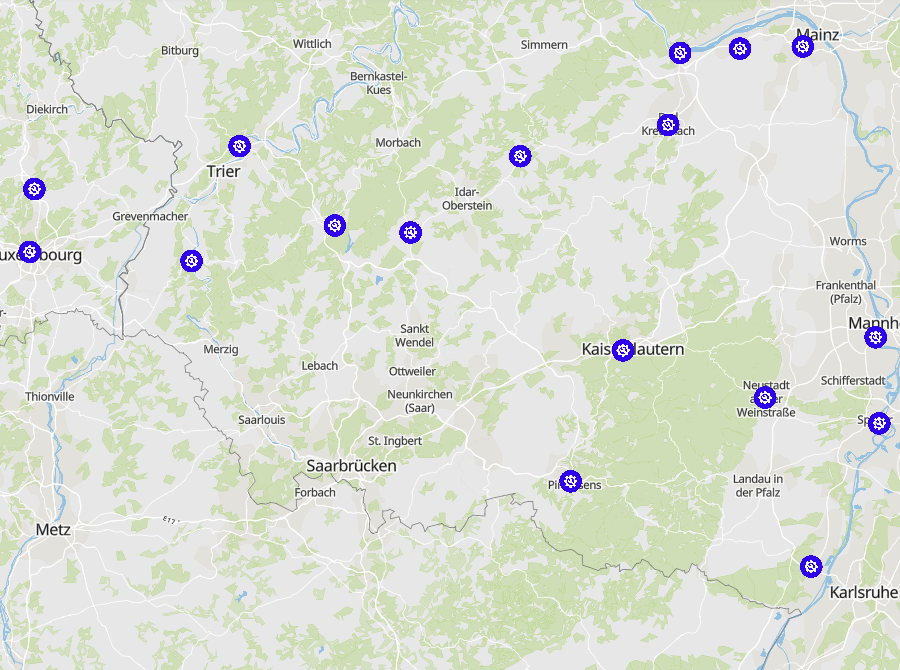
Presence of the Common midwife toad (Alytes obstetricans) - Illustration as grid cells 10x10km - Data sources: MNHN Luxemburg, MNHN France, Ministerium für Umwelt und Verbraucherschutz Saarland, Landesamt für Umwelt (LfU) Rheinland-Pfalz, SPW/ARNE/DEMNA, Natagora and collaborators