 geocatalogue.geoportail.lu
2020
Type of resources
Available actions
Topics
Keywords
Contact for the resource
Provided by
Groups
Years
Representation types
Update frequencies
status
Scale
-
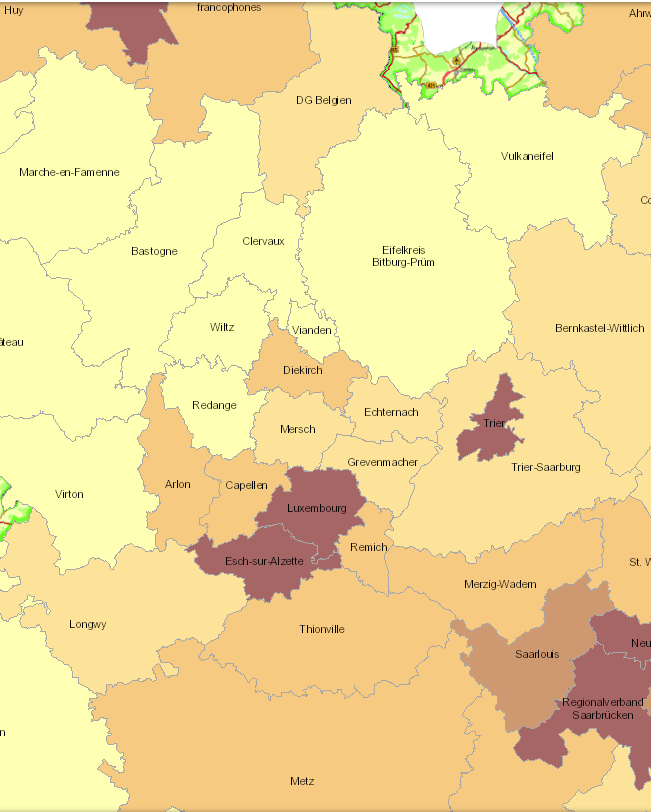
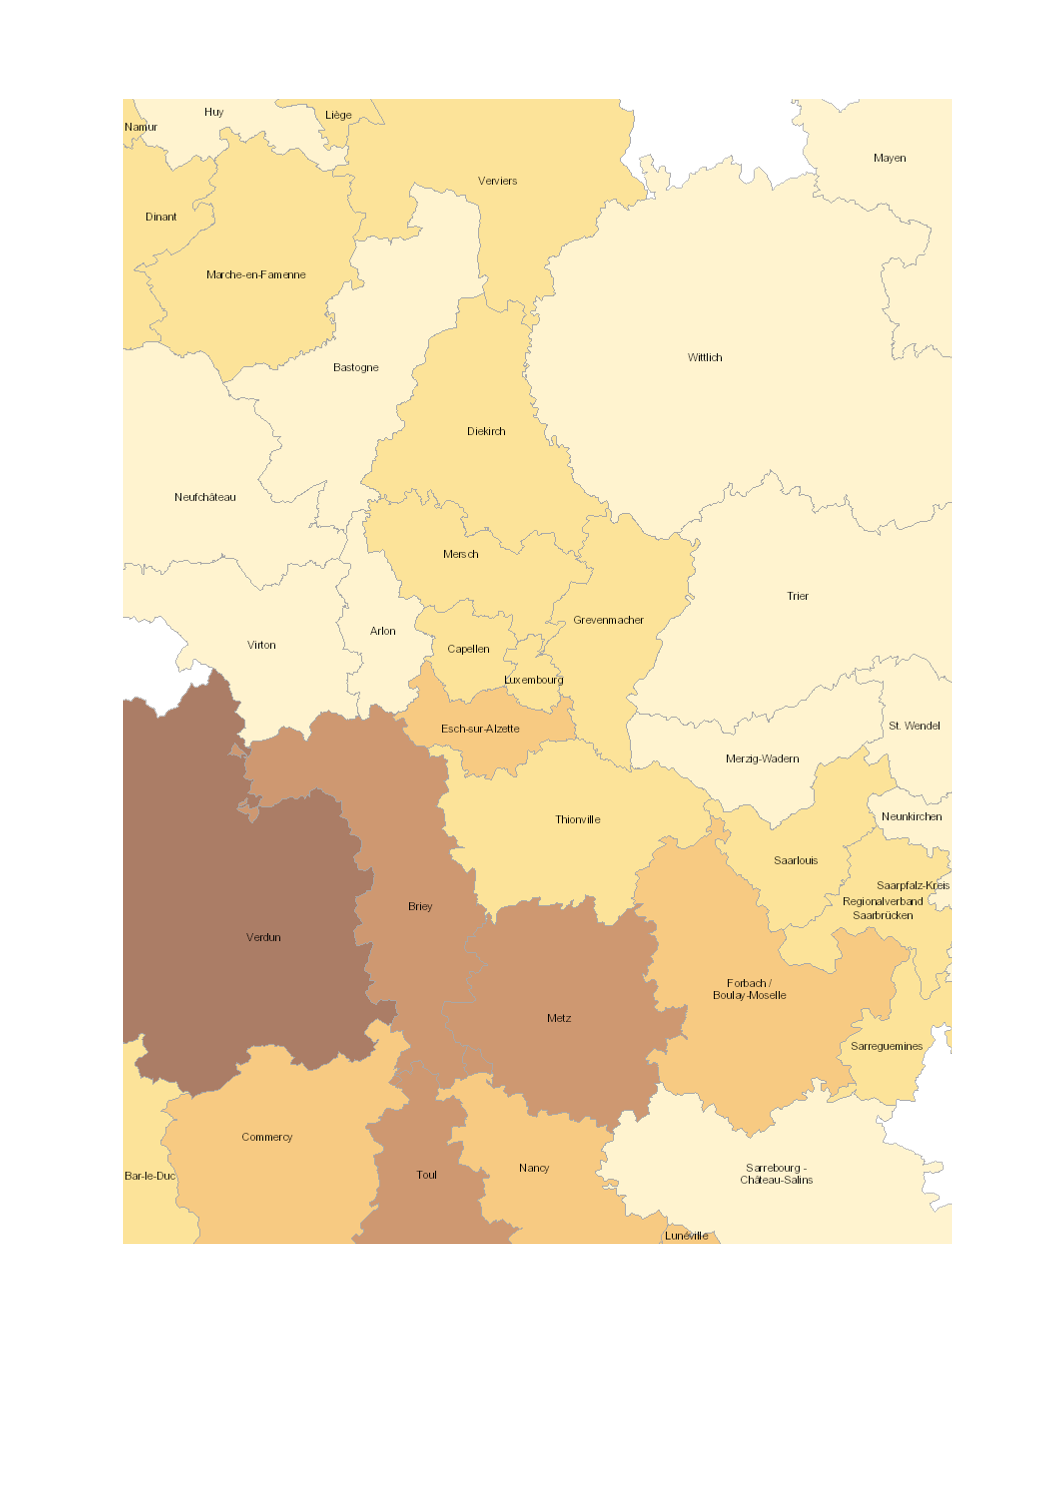
- Population density 2019 (inhabitants per km²), Lorraine: 2017 - Territorial entities: arrondissements (Wallonie), zones d'emploi (Lorraine), cantons (Luxembourg), Kreise (Saarland, Rheinland-Pfalz) - Statistical data sources: Destatis, Eurostat, INSEE, Statbel, STATEC. Harmonization: IBA / OIE 2020 - Geodata sources: GeoBasis-DE / BKG 2017, IGN France 2017, NGI-Belgium 2017, ACT Luxembourg 2017. Harmonization: SIG-GR / GIS-GR 2020
-
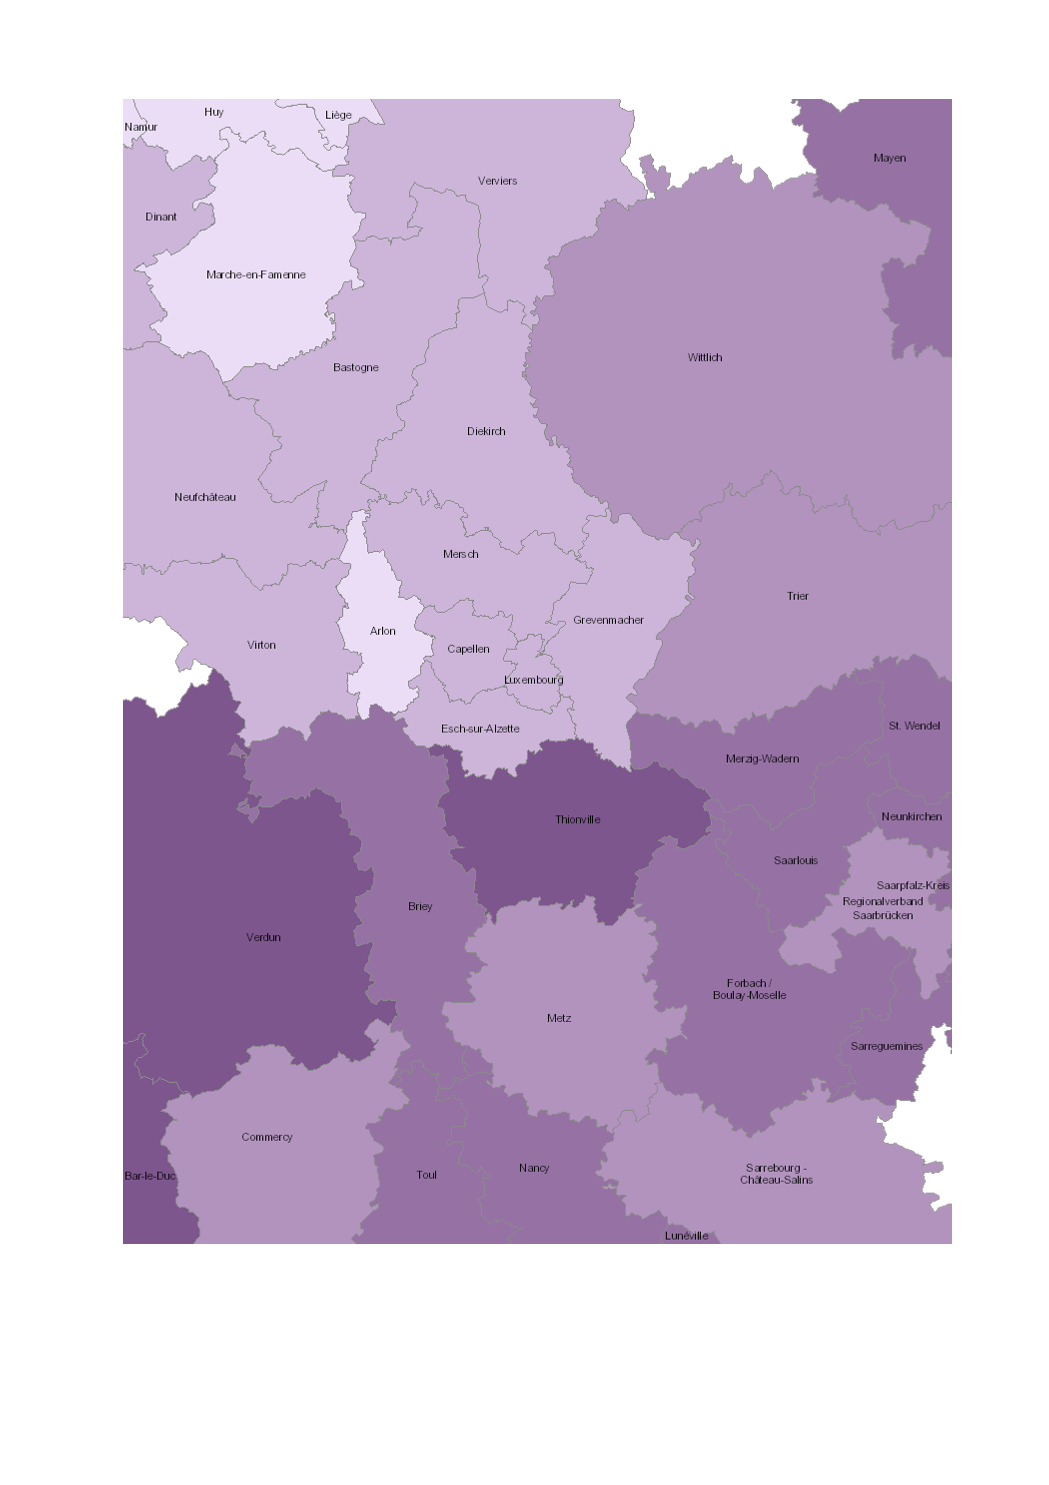
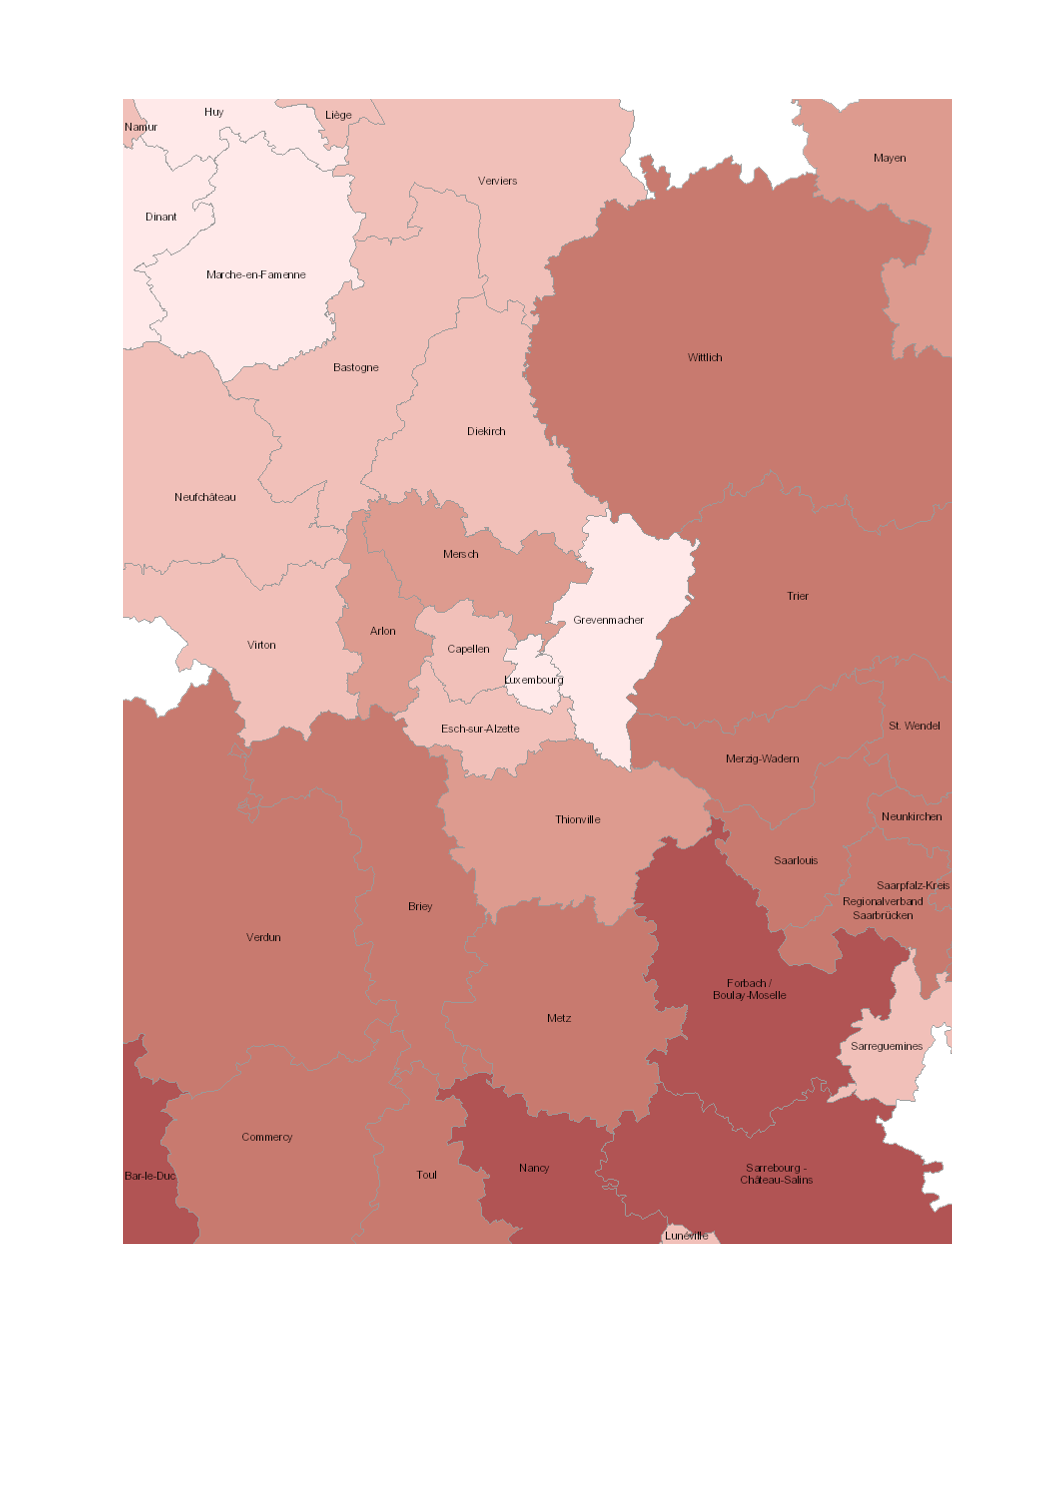
Share of road traffic accidents involving injury with seniors (aged 65+ years) 2015-2019 - Source: Sub-Working Group on Road Safety of the Summit of the Greater Region 2020 - Base map: © ACT Luxembourg 2017, IGN France 2017, GeoBasis-DE / BKG 2017, NGI-Belgium 2017
-
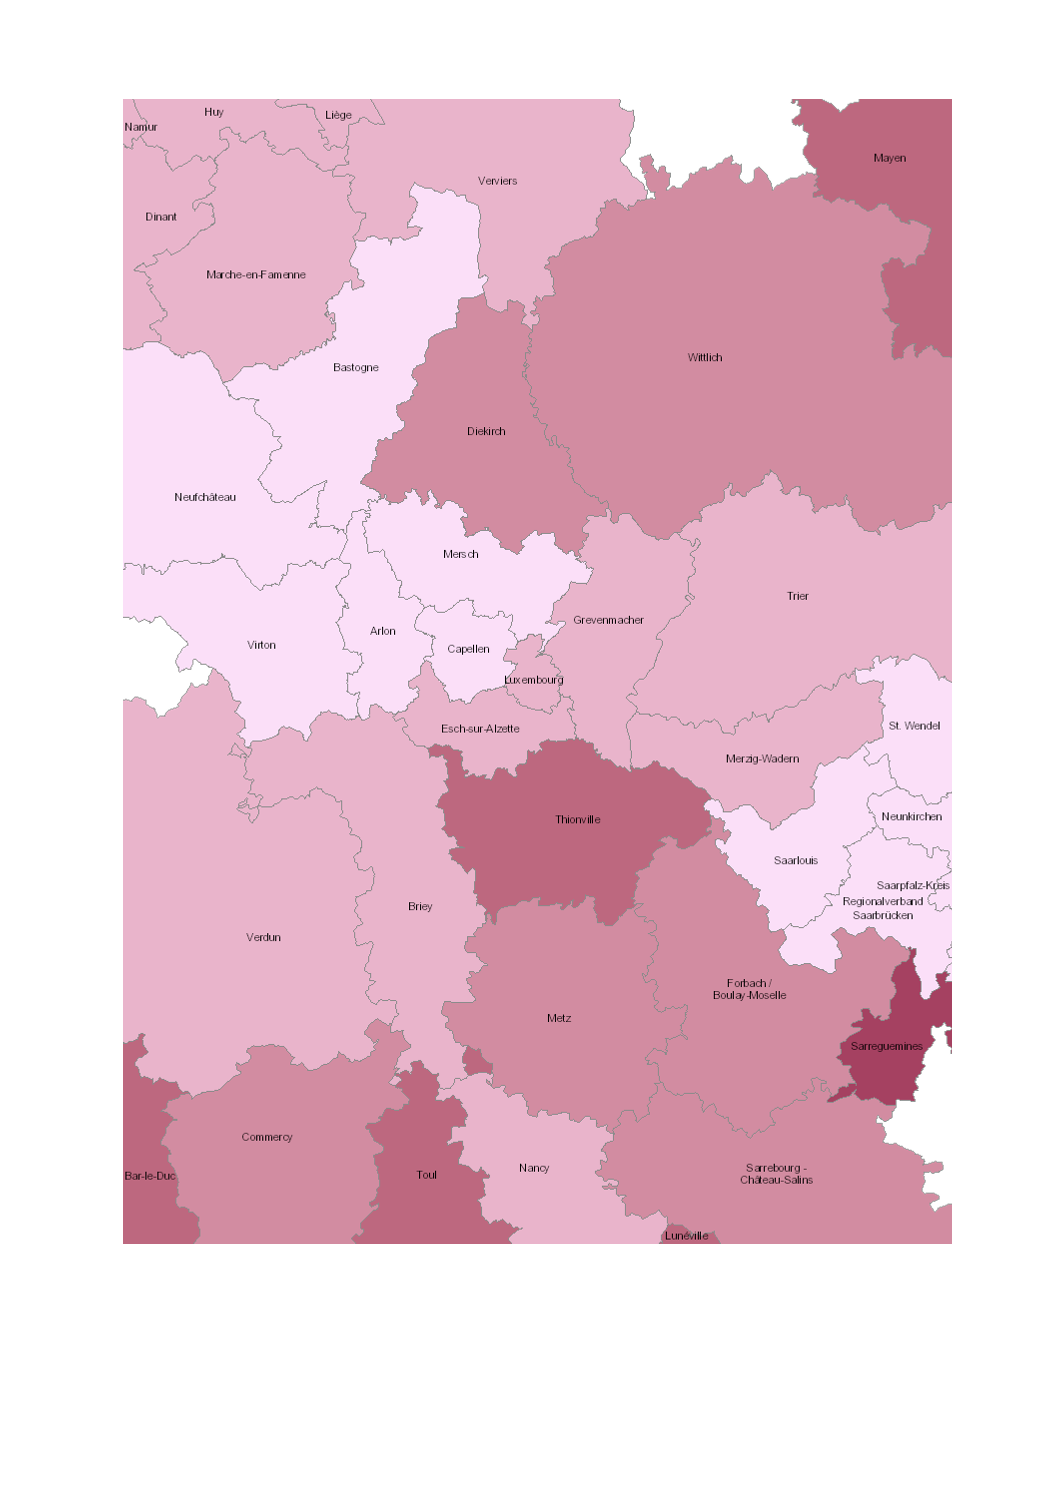
Share of road traffic accidents involving injury with motorized two-wheel vehicles (2015-2019) - Source: Sub-Working Group on Road Safety of the Summit of the Greater Region 2020 - Base map: © ACT Luxembourg 2017, IGN France 2017, GeoBasis-DE / BKG 2017, NGI-Belgium 2017
-
- Spatial planning documents at national/regional level of the greater-regional partners (08/2020) - Sources: MEA-Dater 2020; MDI Rheinland-Pfalz 2020; Région Grand Est 2020; MIBS Saarland 2020
-
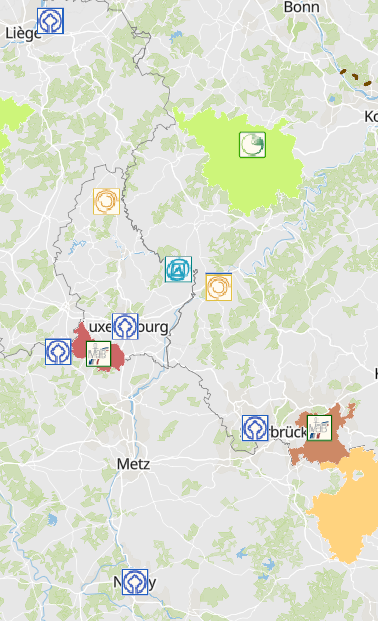
Recognized UNESCO sites 2020: - World Heritage - Intangible Cultural Heritage - Memory of the World Register - Global Geopark - Biosphere reserve - Sources: Espace culturel Grande Région / Kulturraum Großregion 2020; UNESCO 2020; Verein Deutsche Limes-Straße e.V 2018; SGD Nord 2015
-
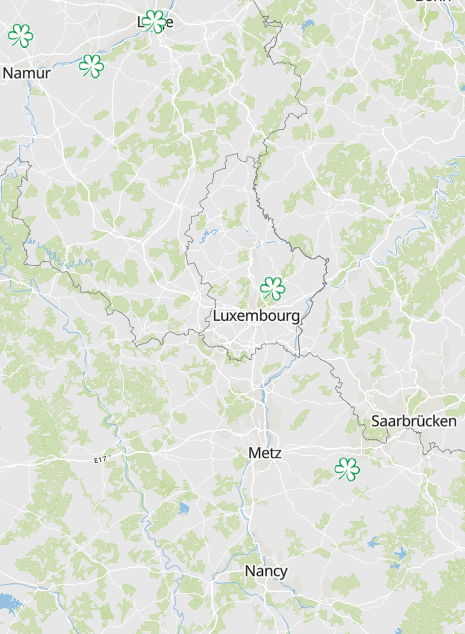
Green stars restaurants of the Guide Michelin 2022 - Source: Guide Michelin 2022
-
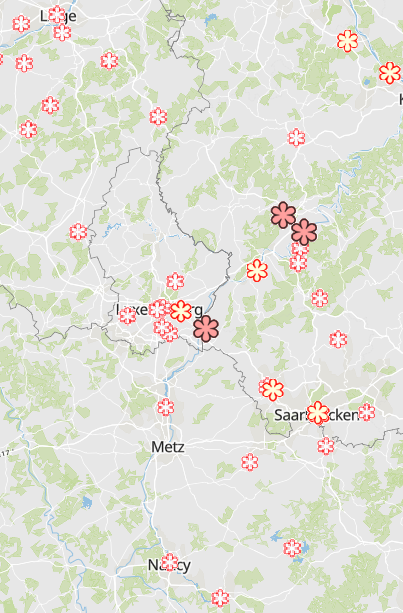
Starred restaurants of the Guide Michelin 2022 - Source: Guide Michelin 2022
-
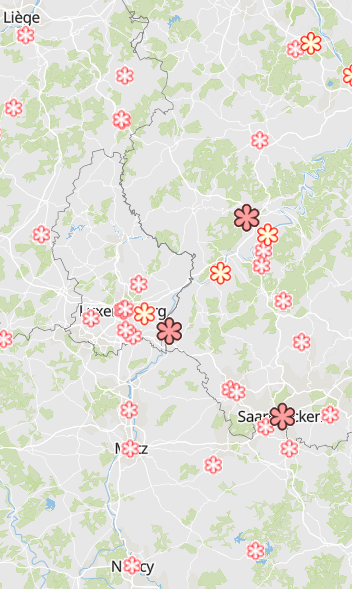
Starred restaurants of the Guide Michelin 2020 - Source: Guide Michelin 2020
-
Share of road traffic accidents involving injury with children (aged 0-14 years) 2015-2019 - Source: Sub-Working Group on Road Safety of the Summit of the Greater Region 2020 - Base map: © ACT Luxembourg 2017, IGN France 2017, GeoBasis-DE / BKG 2017, NGI-Belgium 2017
-
Share of road traffic accidents involving injury with young car drivers (aged 18-24 years) 2015-2019 - Source: Sub-Working Group on Road Safety of the Summit of the Greater Region 2020 - Base map: © ACT Luxembourg 2017, IGN France 2017, GeoBasis-DE / BKG 2017, NGI-Belgium 2017