 geocatalogue.geoportail.lu
2018
Type of resources
Available actions
Topics
Keywords
Contact for the resource
Provided by
Groups
Years
Representation types
Update frequencies
status
Scale
-
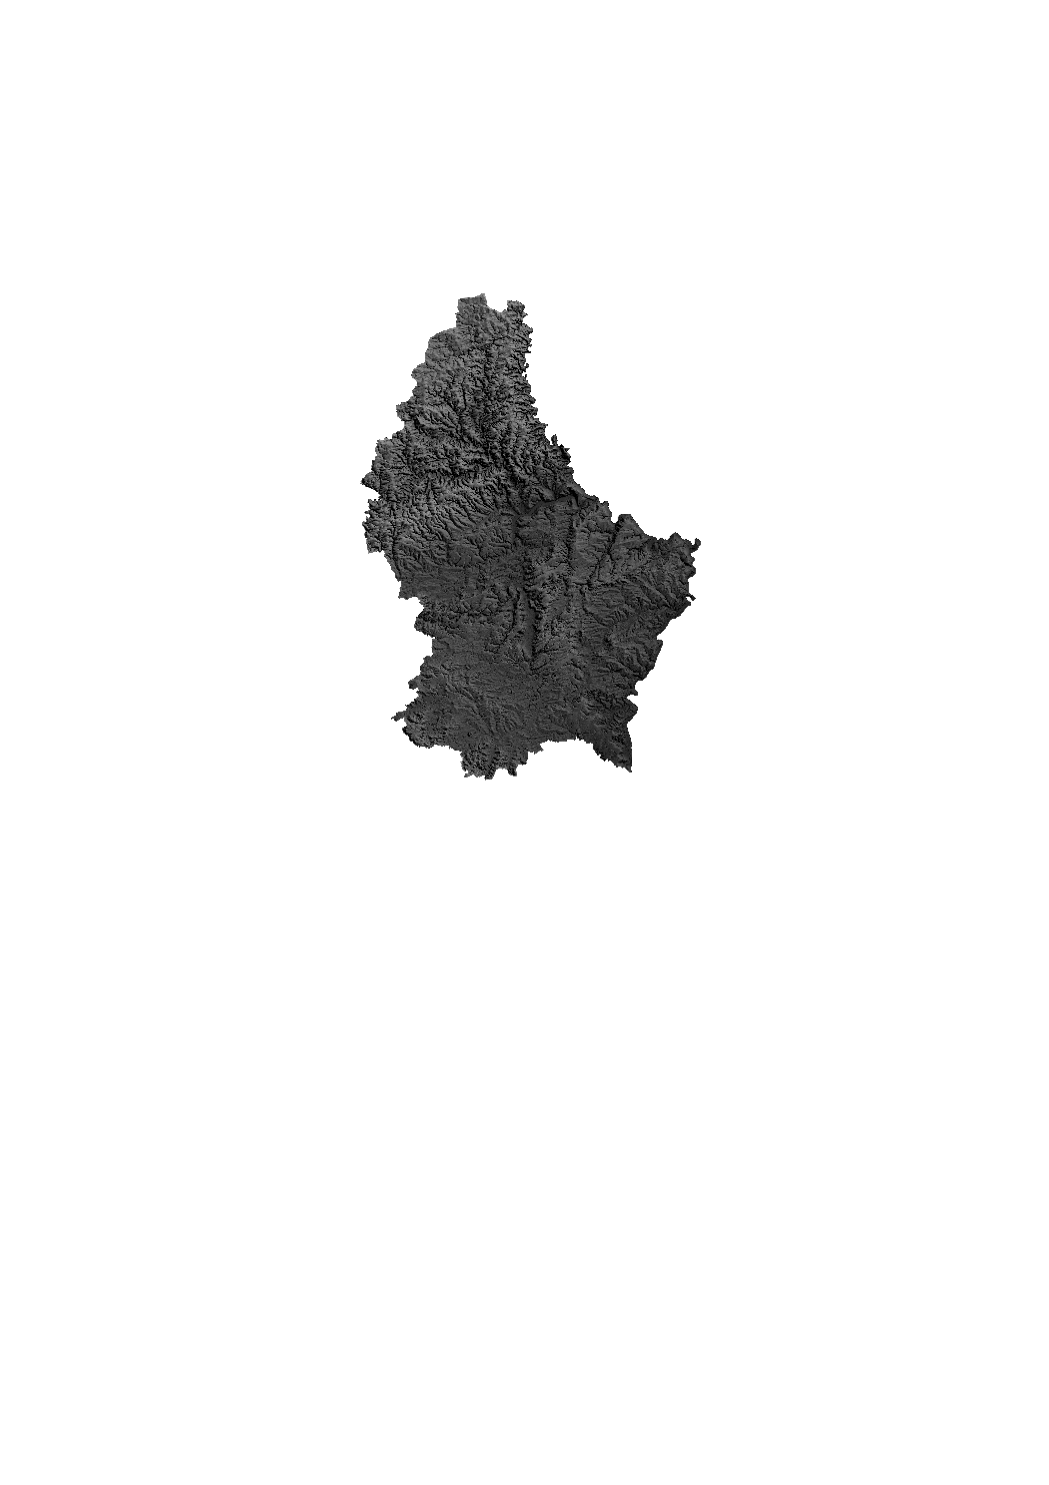
Grayscale relief raster based on Digital Elevation Model from 2017. The DEM from 2017 is based on a photogrammetric exploitation of aerial images and has a ground resolution of 1 m approximately.
-
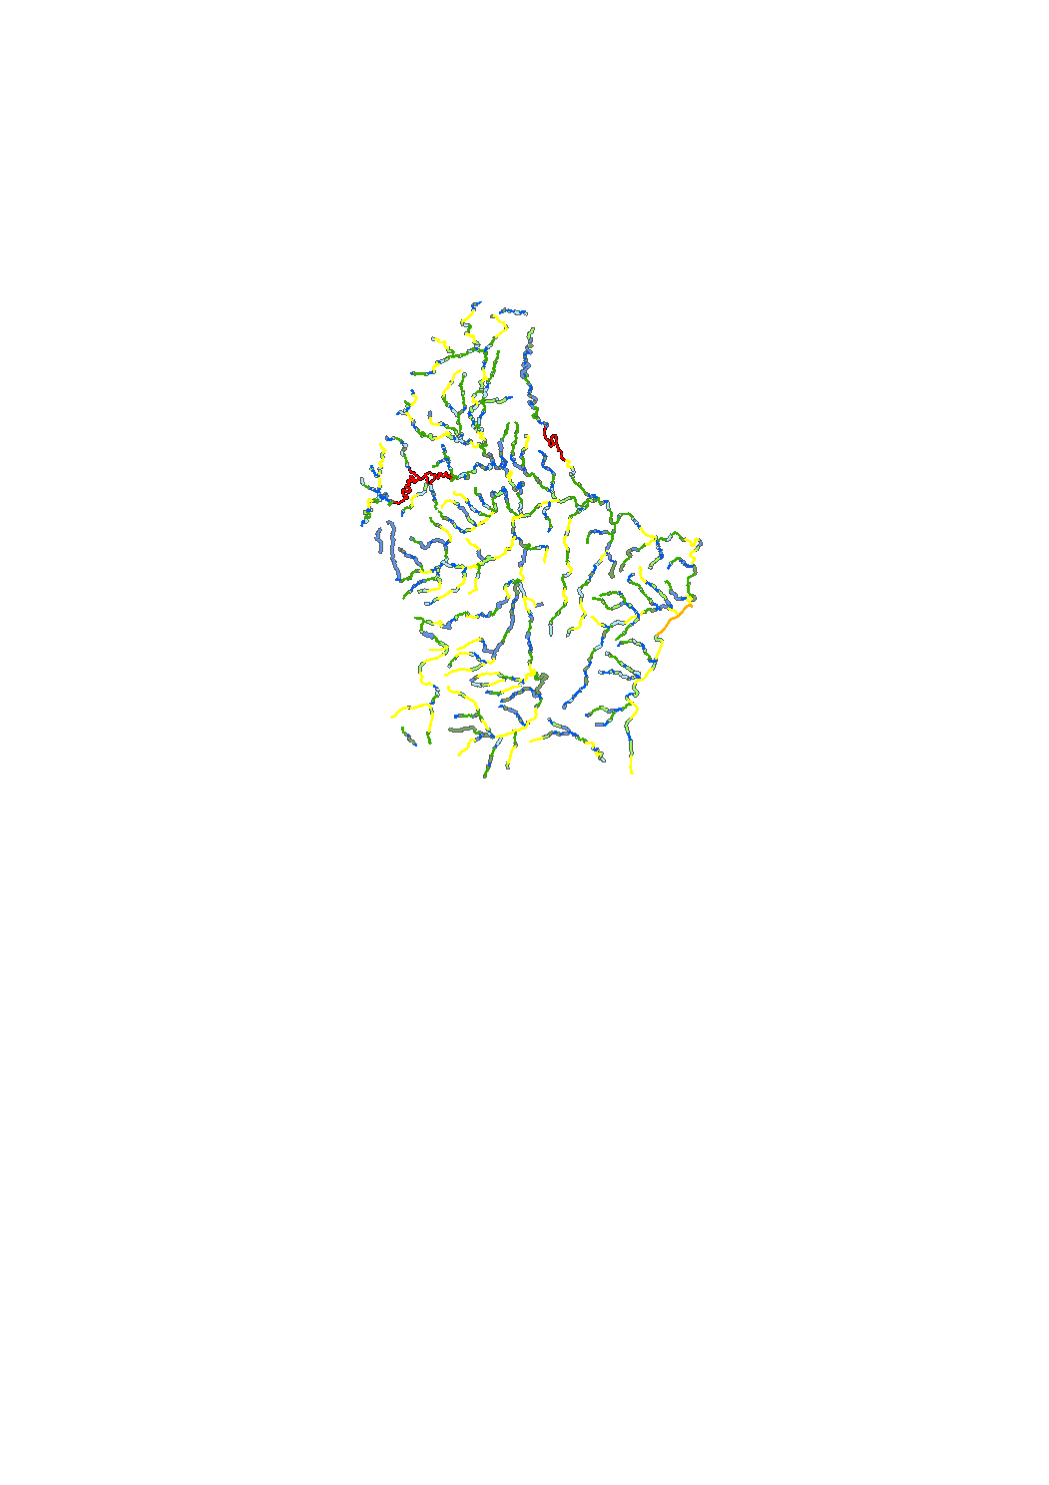
The concept of aquatic habitat connectivity is based on the migration of aquatic species from habitats presenting favorable local conditions to habitats presenting less favorable habitats. Based on the structural quality mapping carried out in 2019-2020 and the planning conditions and restrictions, the watercourse network of the luxemburgish surface water bodies was divided into six categories of functional elements.
-
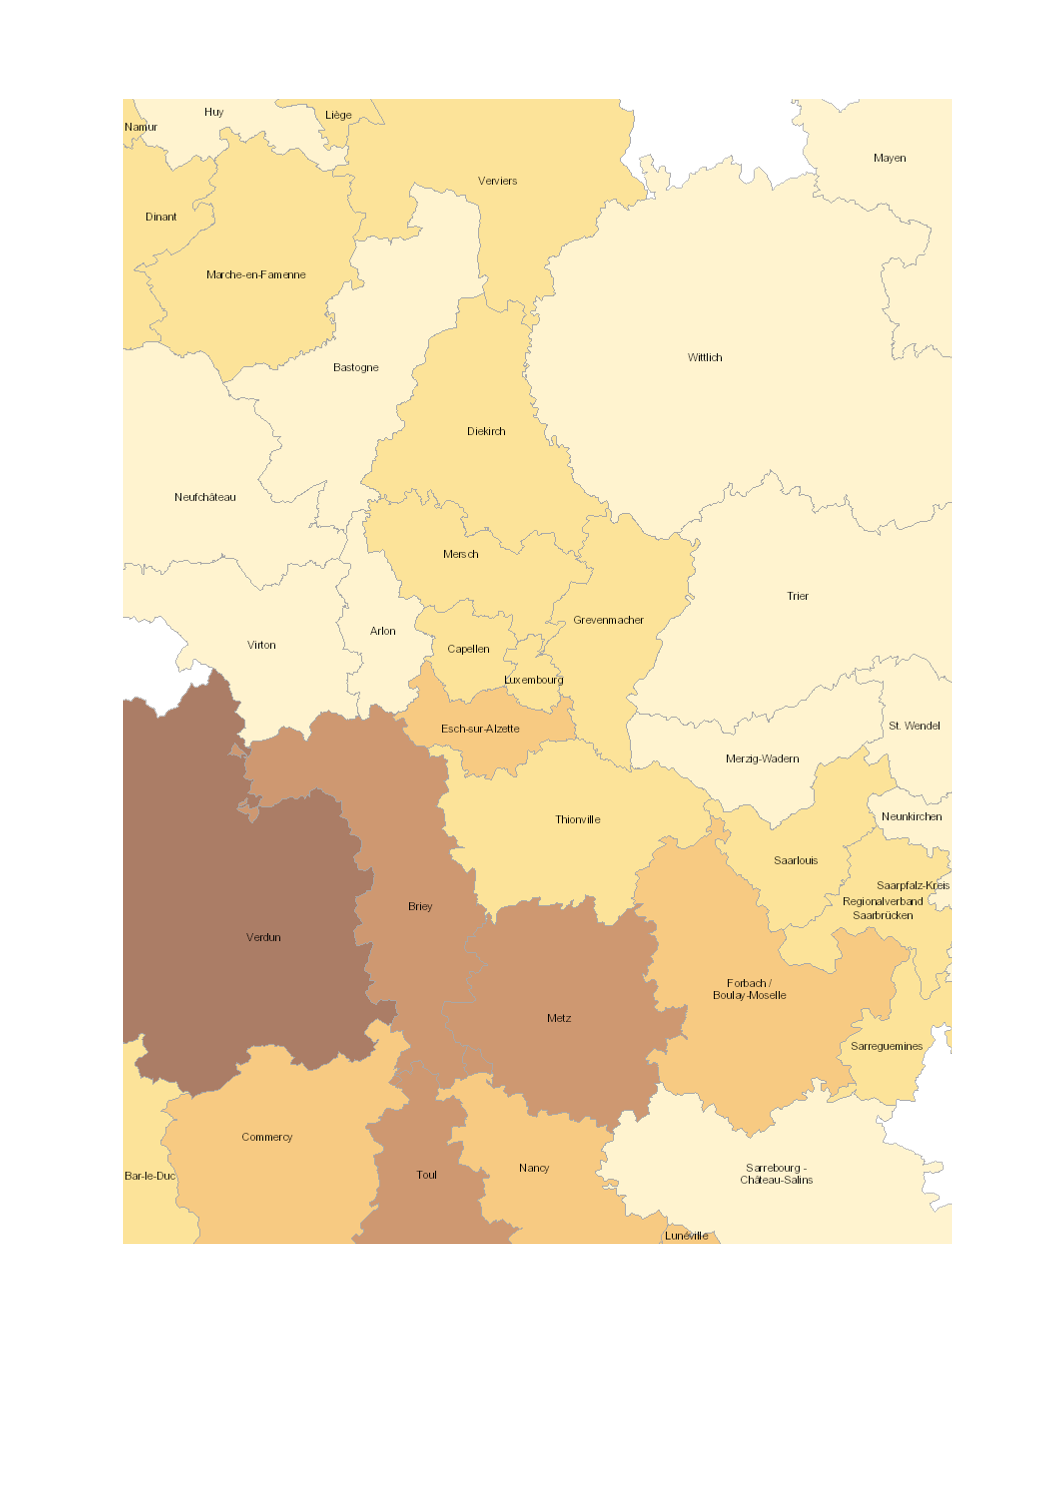
Share of road traffic accidents involving injury with children (aged 0-14 years) 2012-2016 - Source: Sub-Working Group on Road Safety of the Summit of the Greater Region 2017 - Base map: © ACT Luxembourg 2017, IGN France 2017, GeoBasis-DE / BKG 2017, NGI-Belgium 2017
-
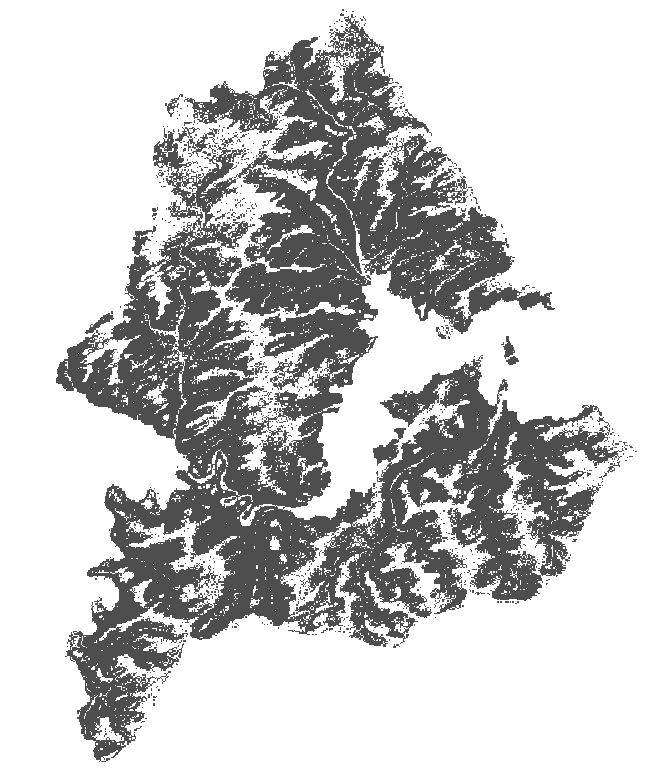
According to the ordinance of april 16, 2021 of the sanitary protection zones of the Upper Sûre lake, the temporary storage of silage as mentioned in point 6.12.2. (Index 27) of the appendix II, compost (point 6.17.2., index 29, appendix II) and manure as mentioned in point 6.18.2. (index 30) of the appendix II on sub-parcels of the protection zones IIC and III that show a slope of less than 5% is allowed, respecting certain conditions. Citizens concerned can use the map to see which sub-parcels within the agricultural areas are affected.
-
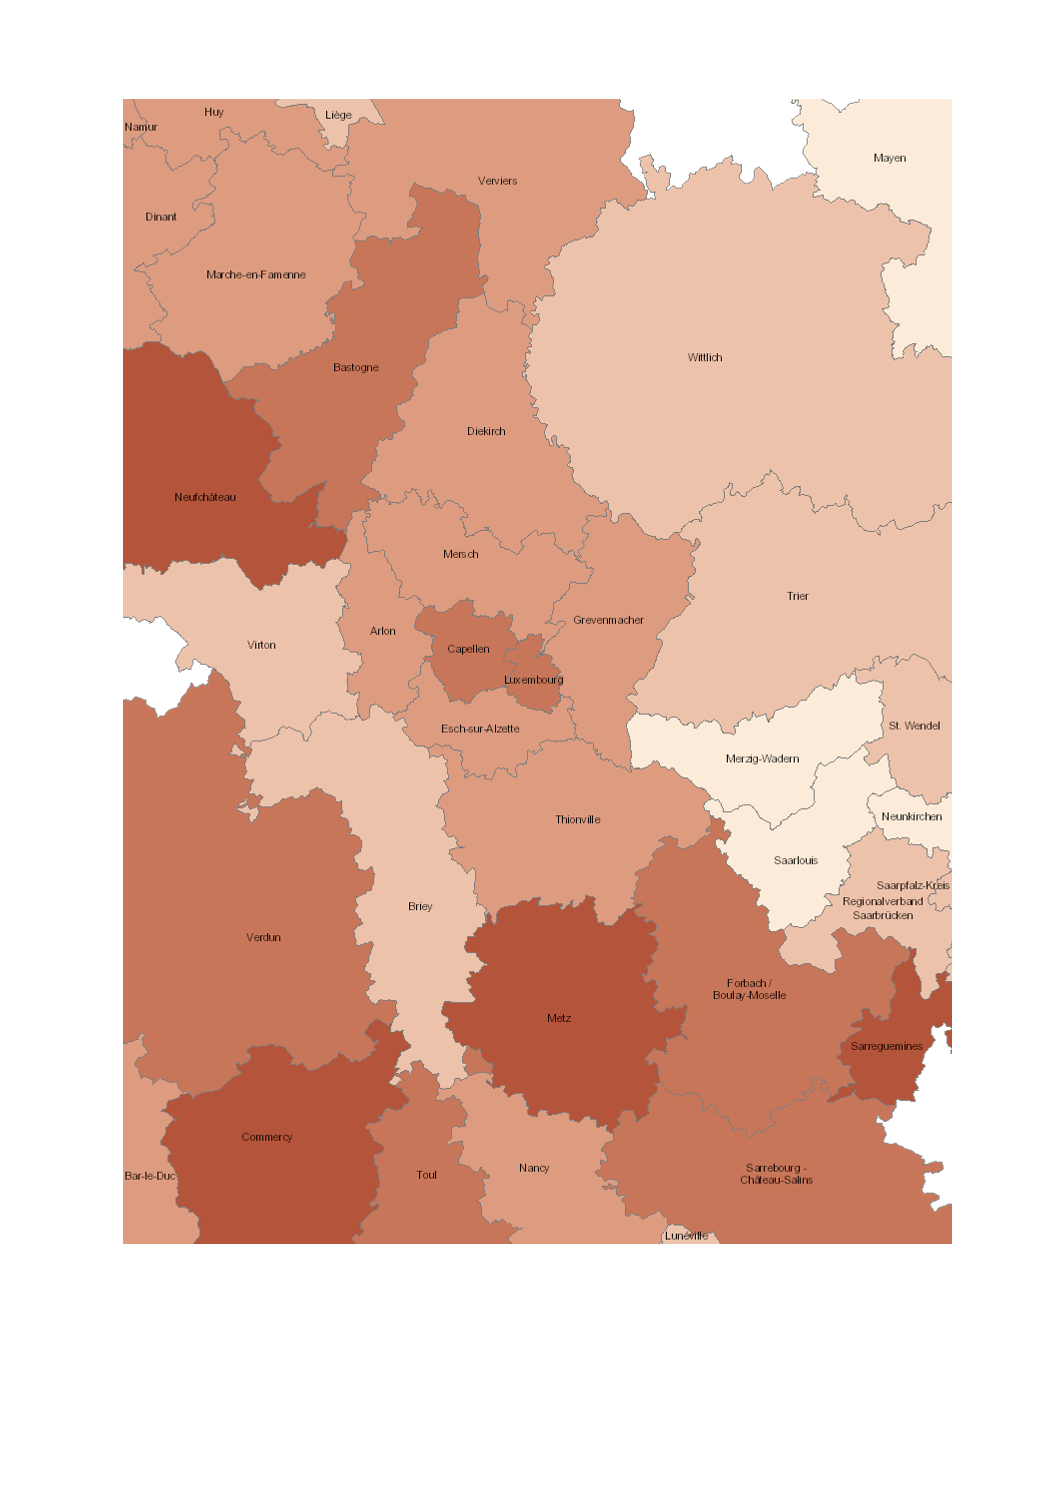
Share of road traffic accidents involving injury with commercial passenger and goods transport vehicles (2012-2016) - Source: Sub-Working Group on Road Safety of the Summit of the Greater Region 2017 - Base map: © ACT Luxembourg 2017, IGN France 2017, GeoBasis-DE / BKG 2017, NGI-Belgium 2017
-
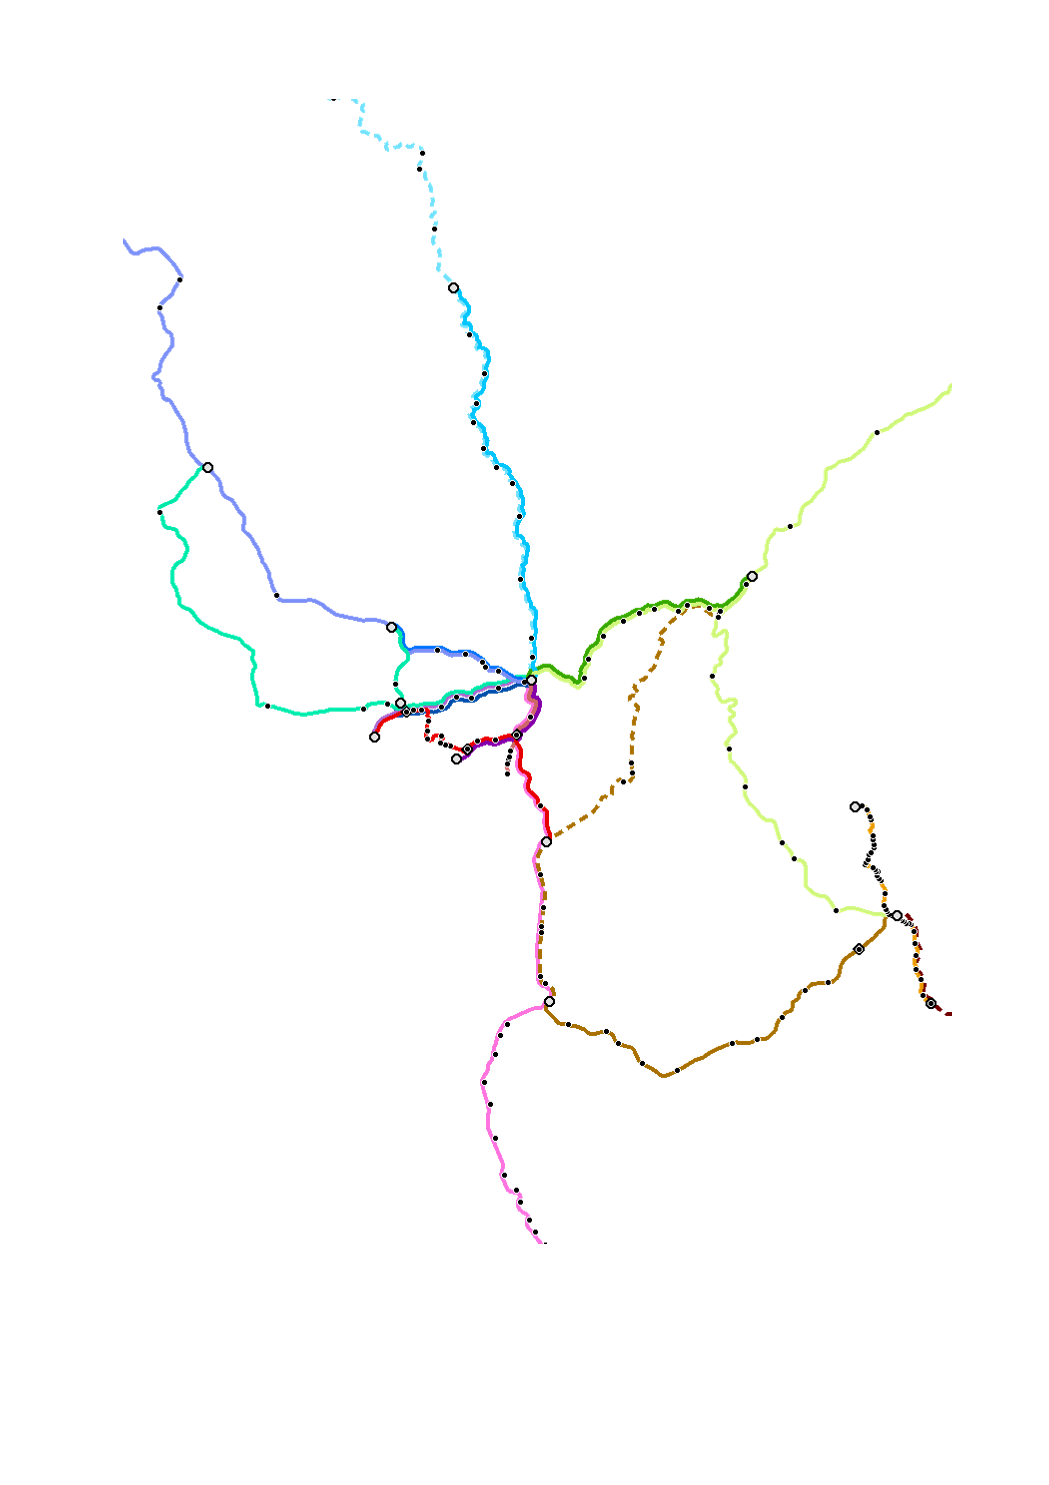
Cross-border railway lines 09/2015 at the internal borders of the Greater Region - Sources: DB; CFL; Communauté des Transports; GR-Atlas; Mobiregio; SNCB; SNCF 2015; Working party "transport" of the Greater Region 2015. Harmonization: SIG-GR / GIS-GR 2015
-
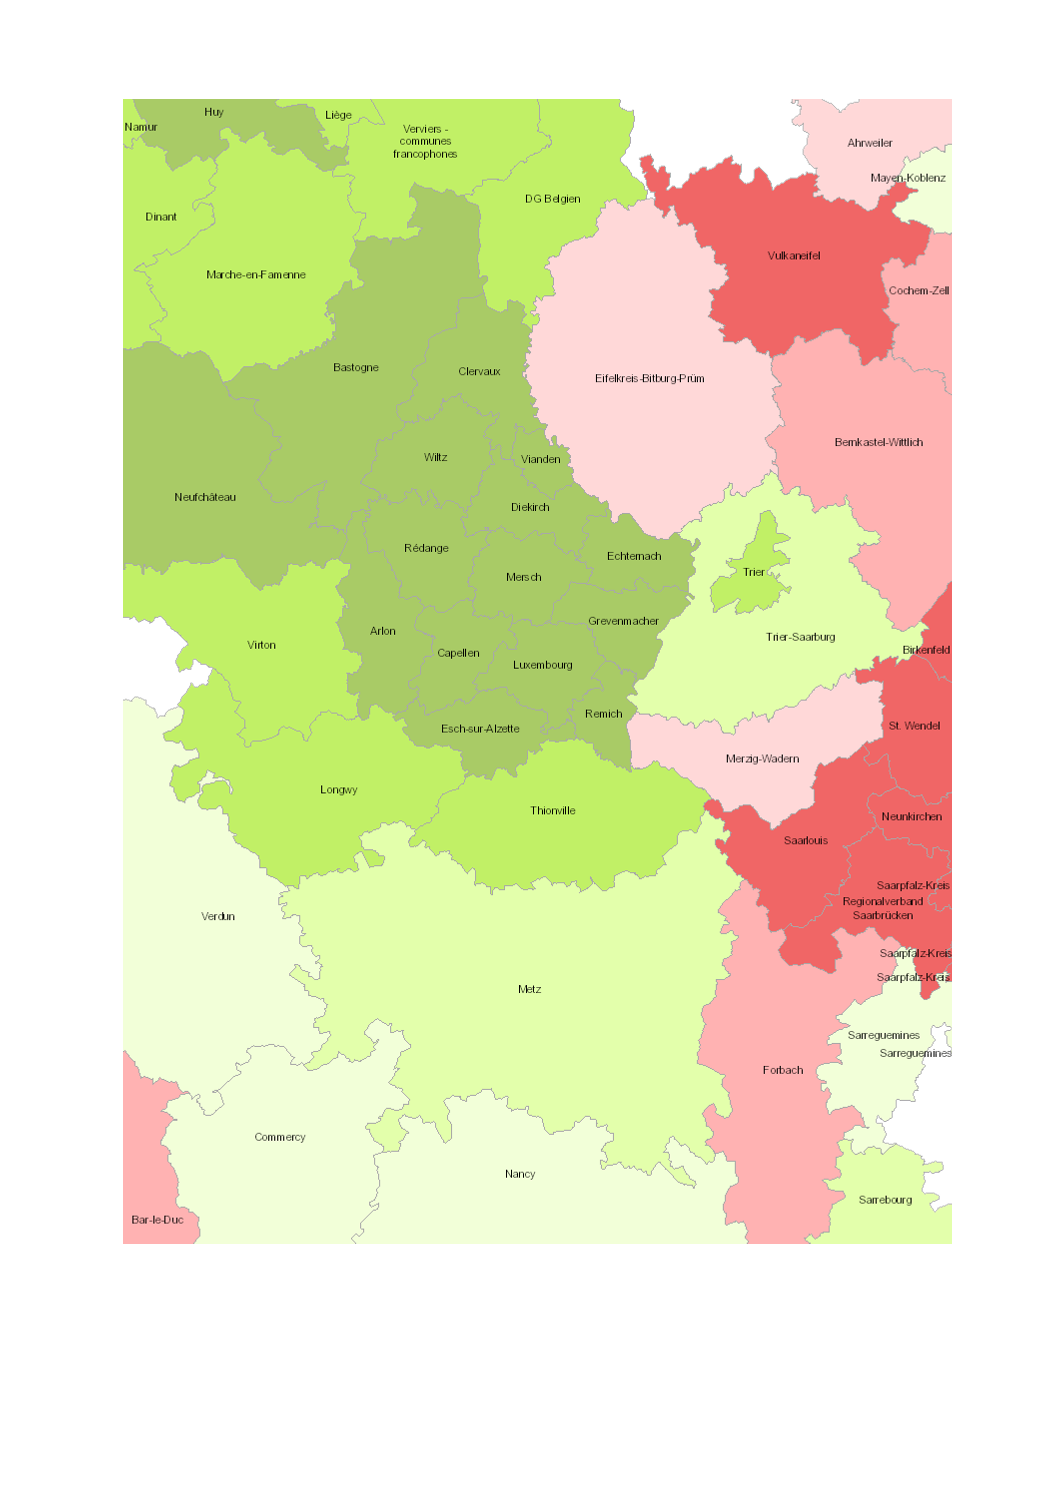
Change in total population 2000-2013 (zones d'emploi Lorraine: 1999-2011) - Territorial entities: arrondissements (Wallonie), zones d'emploi (Lorraine), cantons (Luxembourg), Kreise (Saarland, Rheinland-Pfalz) - Statistical data sources: INSEE Lorraine; SPF Economie; STATEC; Statistisches Landesamt Rheinland-Pfalz; Statistisches Amt Saarland. Calculations: IBA / OIE 2014 - Geodata sources: EuroGeographics EuroRegionalMap v3.0 - 2010. Harmonization: SIG-GR / GIS-GR 2014
-
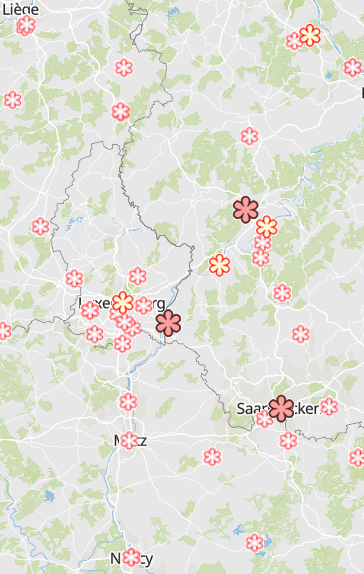
Starred restaurants of the Michelin guide 2018 - Source: ViaMichelin 2018
-
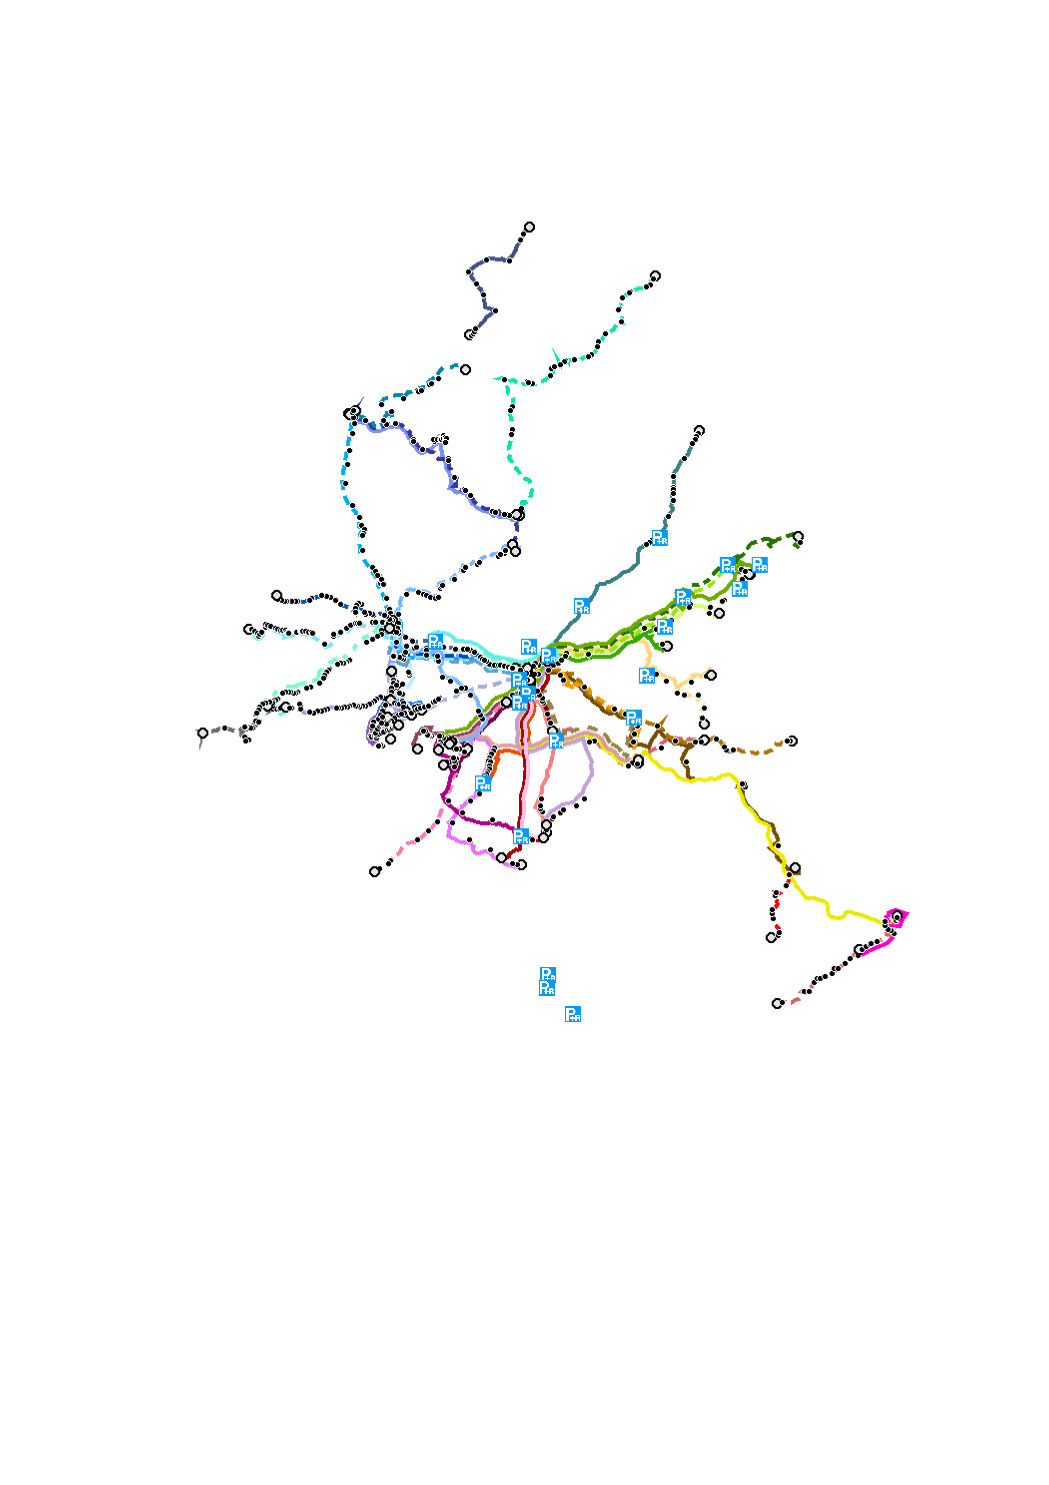
Cross-border bus lines 09/2015 at the internal borders of the Greater Region - Sources: Citéline; Communauté des Transports; GR-Atlas;Mobiregio; TEC 2015; Working party "transport" of the Greater Region 2015. Harmonization: SIG-GR / GIS-GR 2015.
-
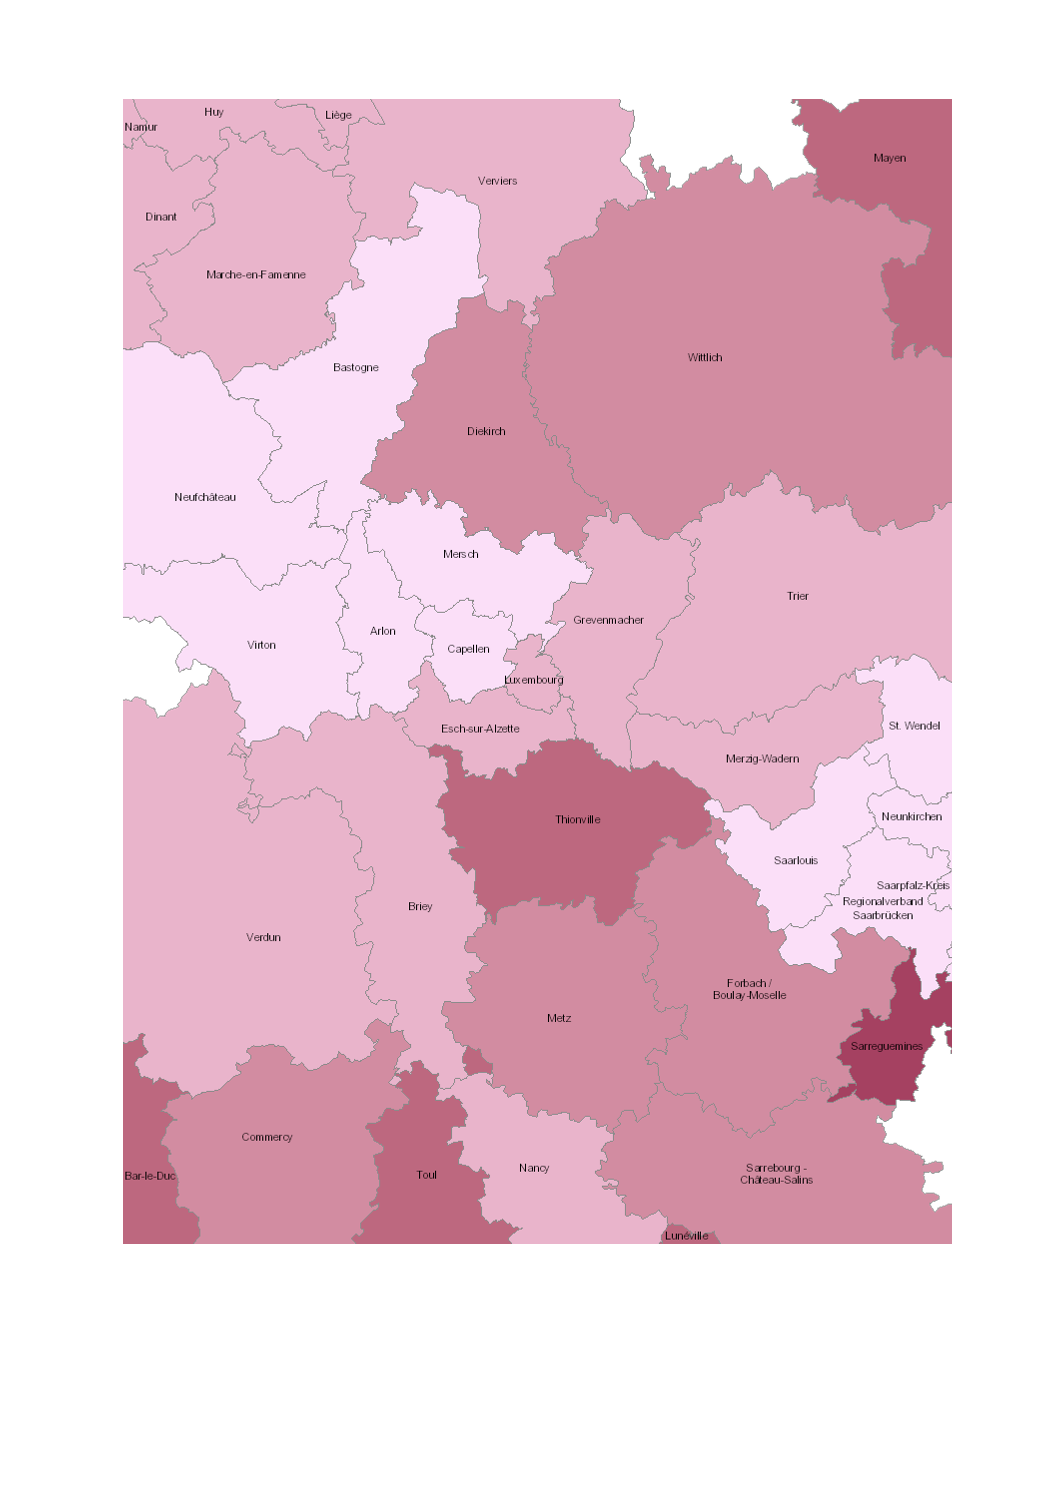
Share of road traffic accidents involving injury with motorized two-wheel vehicles (2012-2016) - Source: Sub-Working Group on Road Safety of the Summit of the Greater Region 2017 - Base map: © ACT Luxembourg 2017, IGN France 2017, GeoBasis-DE / BKG 2017, NGI-Belgium 2017