 geocatalogue.geoportail.lu
Urban Farming
Type of resources
Available actions
Topics
Keywords
Contact for the resource
Provided by
Groups
Years
Representation types
Update frequencies
status
Scale
-

The map identifies the parcels with access to a road (maximum distance of 10 metres).
-

By weighting the previous layers, this indicative map identifies the sites that meet the most criteria corresponding to the chosen project typology. CAUTION, the information provided by the map is indicative and can under no circumstances be certified 100% accurate. The map is based on public data and does not reflect in any way the will of the landowner to implement an urban farming project on the land. Any individual wishing to obtain more information about the land is invited to contact the owner and present his project in the most transparent way possible.
-
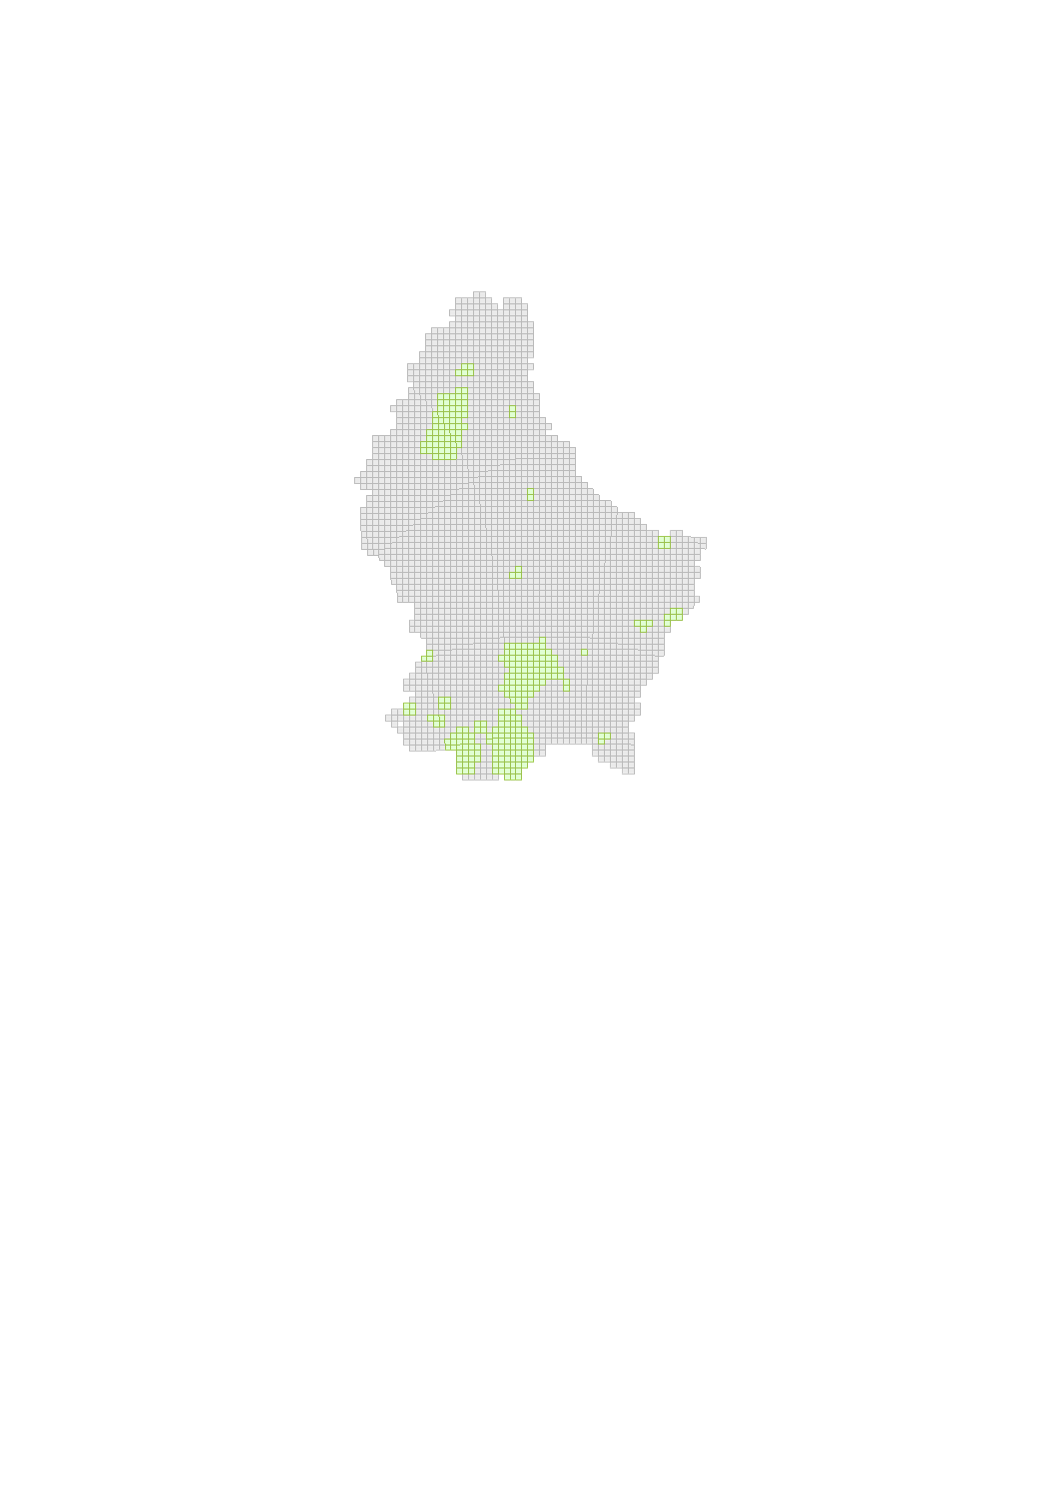
This map with a resolution of 1 x 1 km gives information about the availability of data. For the areas colored in green, a weighting of the different layers has already been calculated for different Urban Farming typologies.
-

By weighting the previous layers, this indicative map identifies the sites that meet the most criteria corresponding to the chosen project typology. CAUTION, the information provided by the map is indicative and can under no circumstances be certified 100% accurate. The map is based on public data and does not reflect in any way the will of the landowner to implement an urban farming project on the land. Any individual wishing to obtain more information about the land is invited to contact the owner and present his project in the most transparent way possible.
-

The map identifies by circles of 300 m radius the sites of distribution and consumption of food products (hotels, restaurants, cafés, schools, training centres, various shops). This distance is still possible for delivery by light transport (on foot, by bicycle, etc.).
-
-

The map identifies buildings with flat roofs. An urban farming activity on a non-flat roof will require a higher investment for the roof adaptation.
-
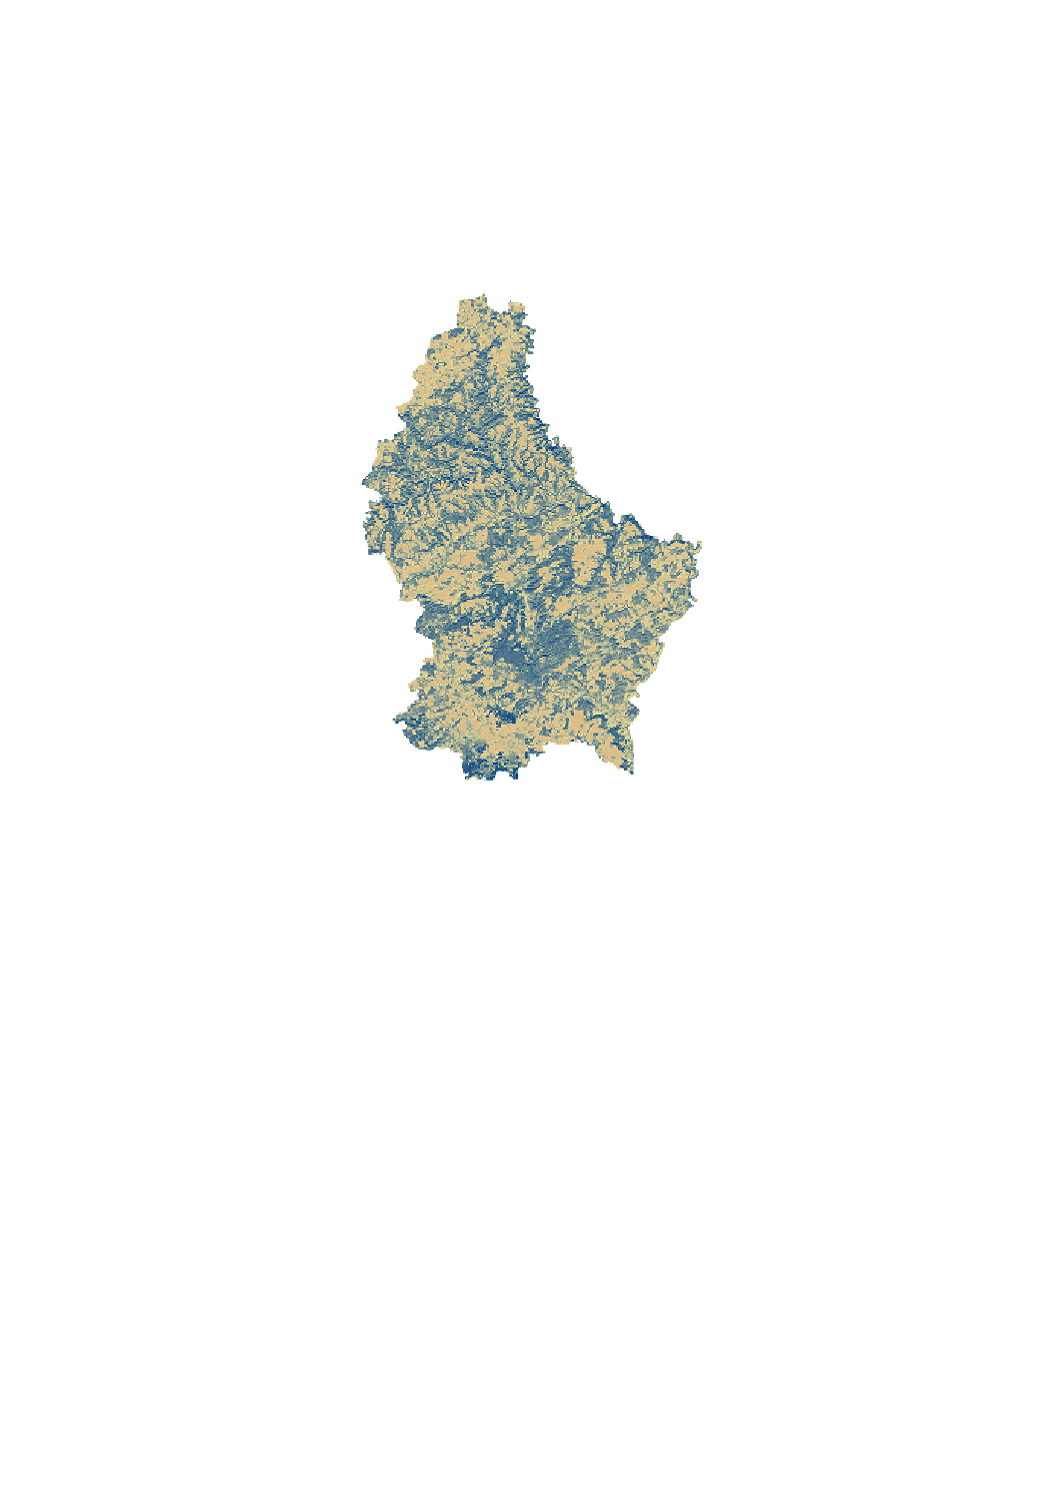
<p>The solar radiation layers are simulations of solar radiation based on the Digital Surface Model. The simulation considers the topographic situation (surrounding, slope, exposition) as well as time-based variation of the sun radiation for a specific geographic location. The result is a raster visualization of the sun duration per pixel (with 1 m ground resolution). The simulation is configured to return the sun hours per pixel for a given day. Currently 3 days were calculated: 15/02 (winter), 15/05 (spring) and 15/08 (summer).</p> <p>The solar radiation analysis is based on the solar radiation toolset of the ESRI ArcMap toolbox. A detailed documentation can be found in the corresponding documentation by ESRI: http://desktop.arcgis.com/en/arcmap/10.6/tools/spatial-analyst-toolbox/area-solar-radiation.htm </p> <a href="http://desktop.arcgis.com/en/arcmap/10.6/tools/spatial-analyst-toolbox/area-solar-radiation.htm">ESRI Documentation</a> <p>The analysis used the following parameters: </p> <p> - Input raster: Digital Surface model provided by the Administration de la navigation aérienne (ANA) based on a LiDAR flight from 2017. (DSM available here : https://data.public.lu/fr/datasets/digital-surface-model-high-dem-resolution/ )</p> <p> - Latitude : 49.46 °</p> <p> - Time configuration : Time Within a day (for 3 dates: 15/02 winter, 15/05 spring and 15/08 summer)</p> <p> - Hour interval: 0.5 The solar radiation was calculated in 30 min. intervals and summed up per day.</p> <p> - Slope and aspect input : The slope and aspect rasters are calculated from the input digital surface model</p> <p> - Calculation directions: 32, which is adequate for a complex topography.</p> <p> - Diffuse proportion : 0.3 for a generally clear sky conditions. </p> <p> - Transmittitivity : 0.5 for a generally clear sky.</p> <p> - Output raster: The result is an output raster representing the duration of direct incoming solar radiation.</p>
-
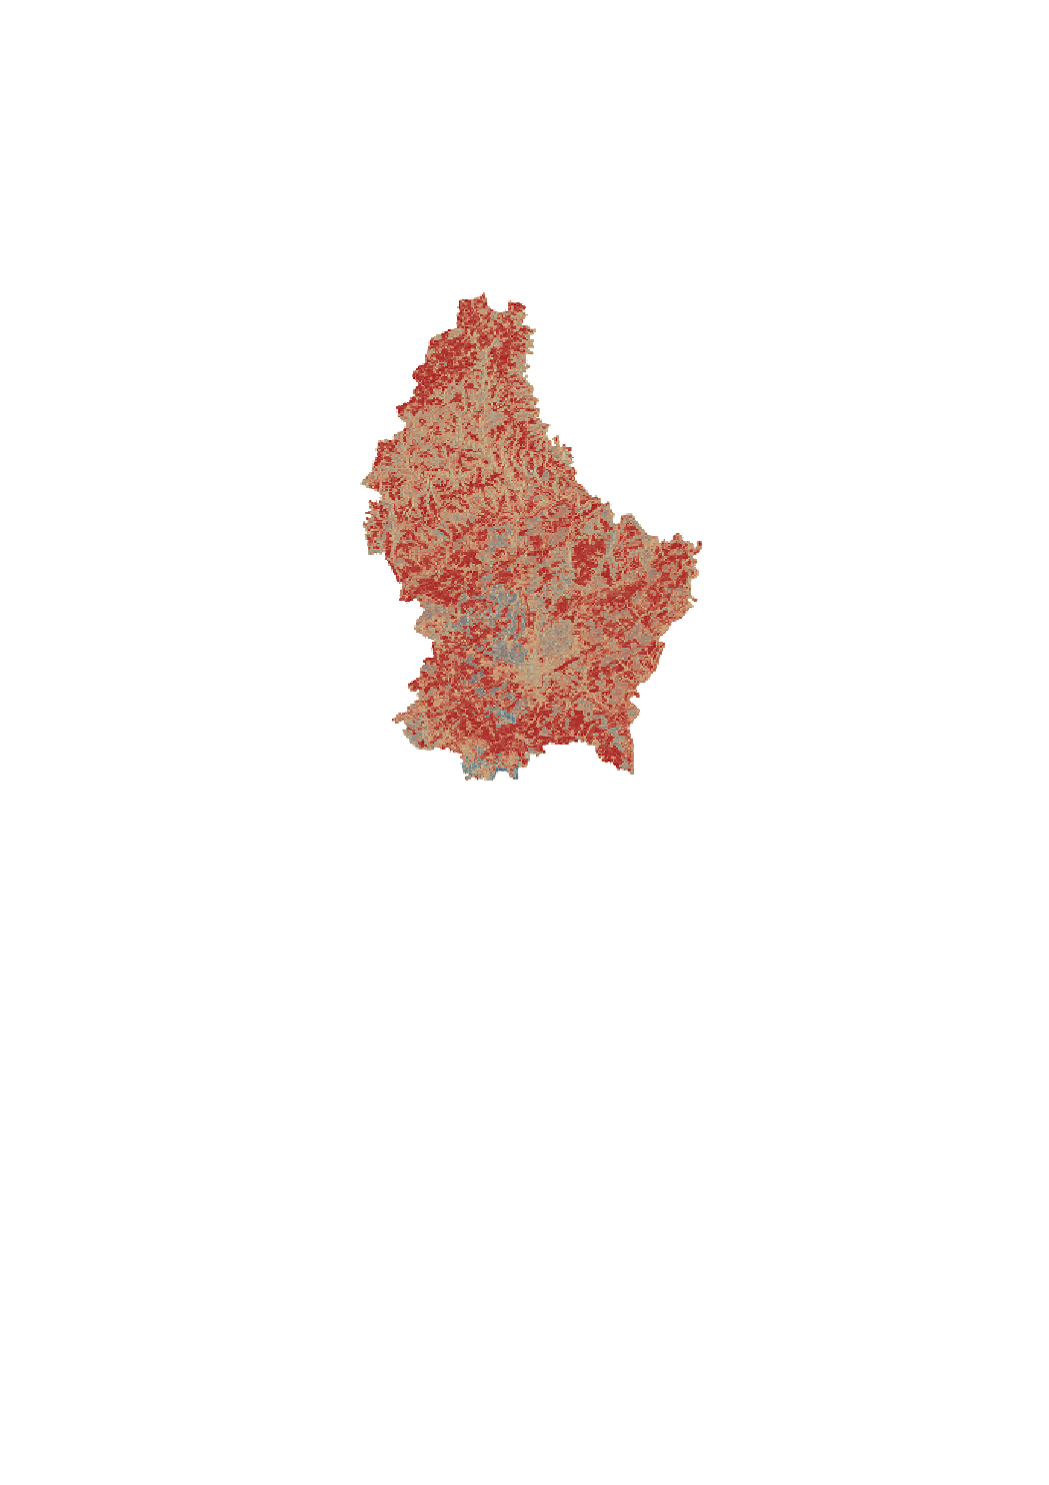
<p>The solar radiation layers are simulations of solar radiation based on the Digital Surface Model. The simulation considers the topographic situation (surrounding, slope, exposition) as well as time-based variation of the sun radiation for a specific geographic location. The result is a raster visualization of the sun duration per pixel (with 1 m ground resolution). The simulation is configured to return the sun hours per pixel for a given day. Currently 3 days were calculated: 15/02 (winter), 15/05 (spring) and 15/08 (summer).</p> <p>The solar radiation analysis is based on the solar radiation toolset of the ESRI ArcMap toolbox. A detailed documentation can be found in the corresponding documentation by ESRI: http://desktop.arcgis.com/en/arcmap/10.6/tools/spatial-analyst-toolbox/area-solar-radiation.htm </p> <a href="http://desktop.arcgis.com/en/arcmap/10.6/tools/spatial-analyst-toolbox/area-solar-radiation.htm">ESRI Documentation</a> <p>The analysis used the following parameters: </p> <p> - Input raster: Digital Surface model provided by the Administration de la navigation aérienne (ANA) based on a LiDAR flight from 2017. (DSM available here : https://data.public.lu/fr/datasets/digital-surface-model-high-dem-resolution/ )</p> <p> - Latitude : 49.46 °</p> <p> - Time configuration : Time Within a day (for 3 dates: 15/02 winter, 15/05 spring and 15/08 summer)</p> <p> - Hour interval: 0.5 The solar radiation was calculated in 30 min. intervals and summed up per day.</p> <p> - Slope and aspect input : The slope and aspect rasters are calculated from the input digital surface model</p> <p> - Calculation directions: 32, which is adequate for a complex topography.</p> <p> - Diffuse proportion : 0.3 for a generally clear sky conditions. </p> <p> - Transmittitivity : 0.5 for a generally clear sky.</p> <p> - Output raster: The result is an output raster representing the duration of direct incoming solar radiation.</p>