 geocatalogue.geoportail.lu
Type of resources
Available actions
Topics
Keywords
Contact for the resource
Provided by
Groups
Years
Representation types
Update frequencies
status
Service types
Scale
-
All natural water expanses and basins.
-
The percentage of analysis in which the parameter clostridium perfringens meets the threshold value
-
The percentage of analysis in which the parameter colony count at 36 °C meets the threshold value
-
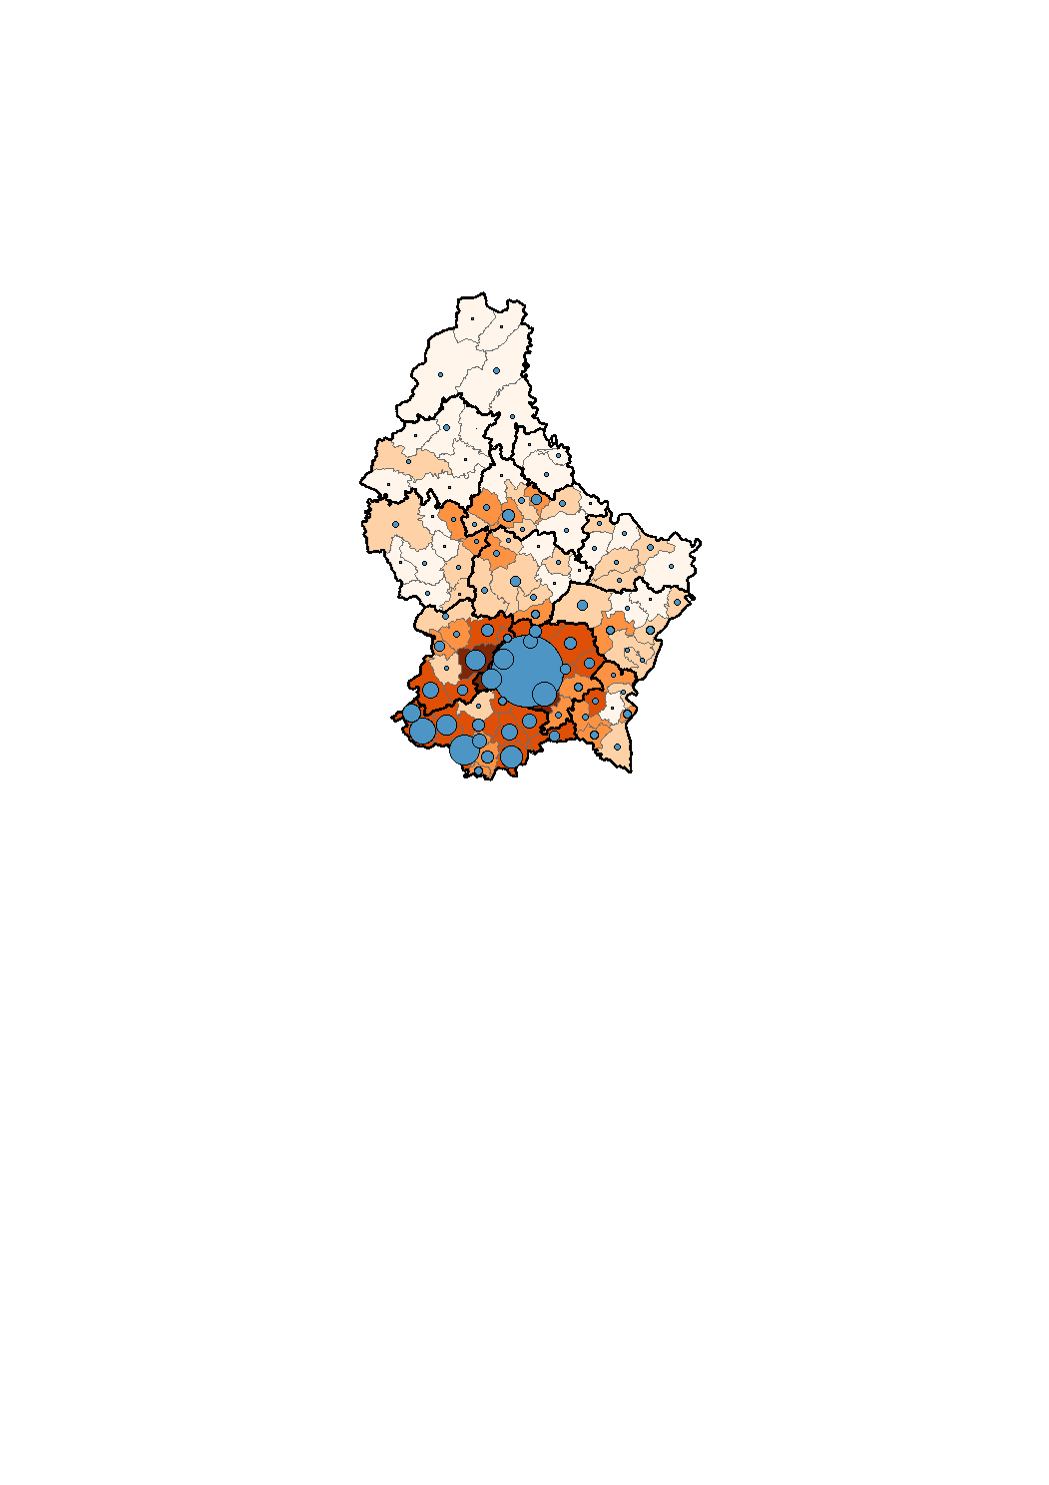
La présence des Italiens se concentre principalement sur la Ville de Luxembourg et les communes avoisinantes de l'agglomération du Luxembourg, ainsi que sur les communes de l'ancien bassin minier du sud et sud-ouest. De plus, une concentration d'Italiens, moins prononcée, peut être observée au niveau de la Nordstad. La part des Italiens dans la population est la plus élevée dans les communes de Bertrange (7.0%), Luxembourg-Ville (6.9%) et Strassen (6.5%). A l'inverse, la part des Italiens dans la population est la plus faible dans les communes de Kiischpelt (0.1%), Esch-sur-Sûre (0.3%) et Putscheid (0.3%). D'une manière générale, à part les alentours de la Nordstad, les Italiens sont relativement peu nombreux dans le nord du pays. En termes absolus, les Italiens sont les plus nombreux à Luxembourg-Ville (8 077), Esch-Alzette (1 333) et Differdange (1 044).
-
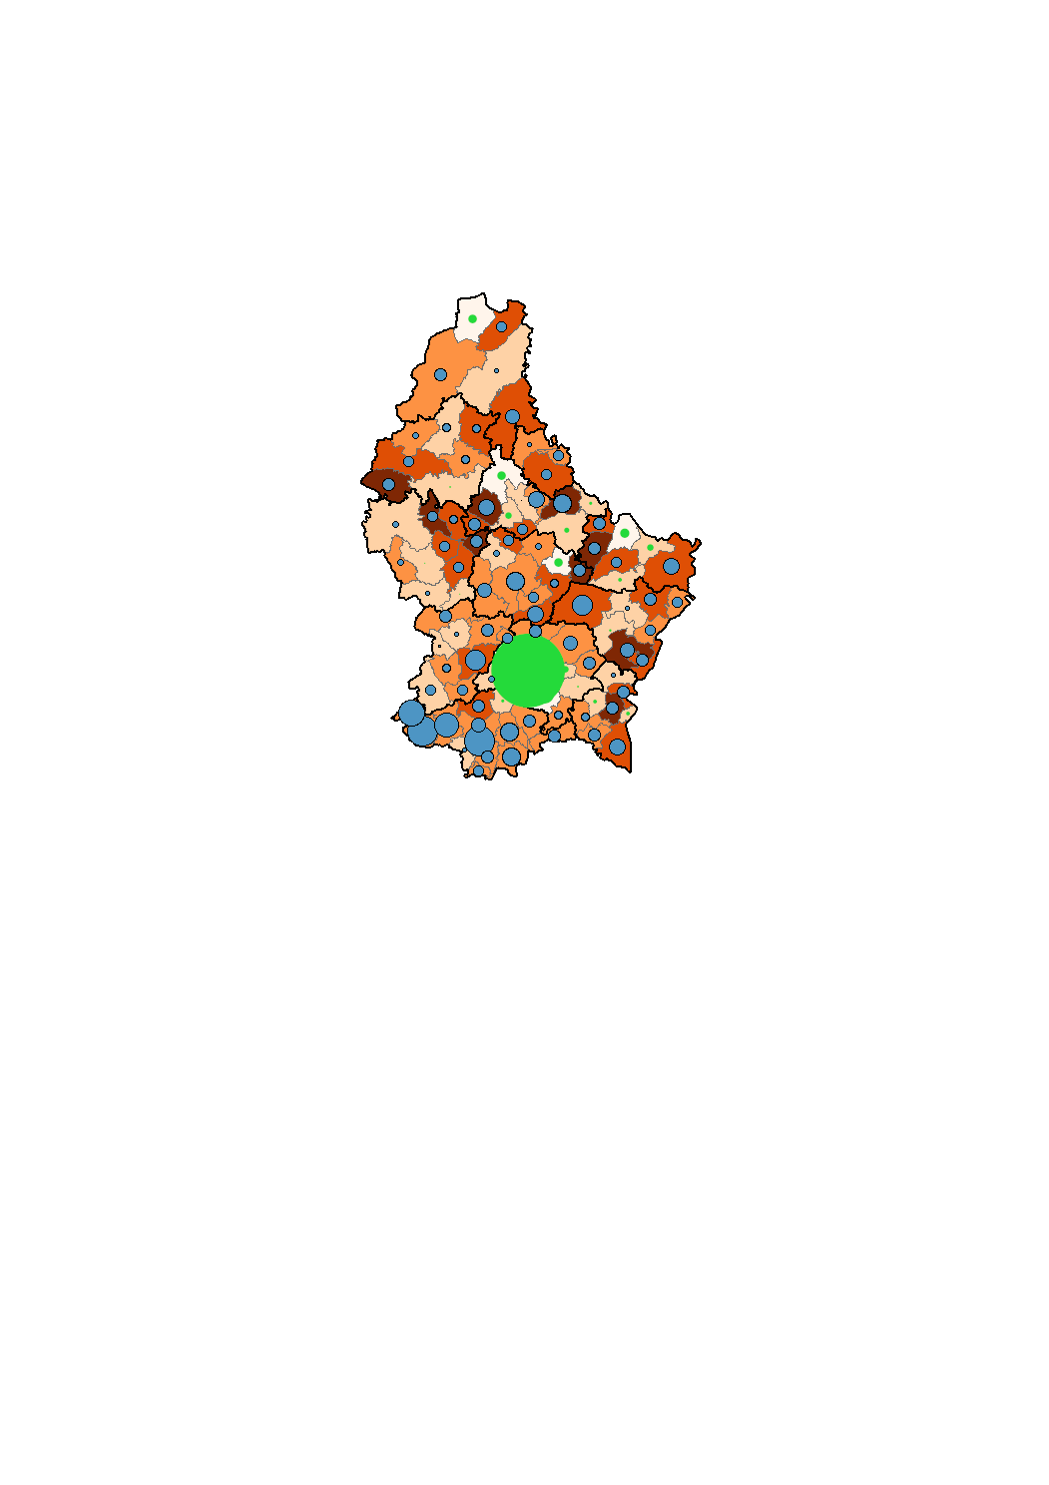
A l'échelle du Grand-Duché de Luxembourg, le solde migratoire interne est évidemment égal à 0 car il n'y a pas de personnes qui quittent le pays: toutes les personnes qui sortent d'une commune s'installent dans une autre commune luxembourgeoise. Les personnes quittant une commune luxembourgeoise pour s'installer à l'étranger sont reprises dans la migration internationale. Au niveau des communes, le solde migratoire interne moyen entre 2013 et 2017 varie fortement d'une commune à l'autre. Sur les 102 communes du Luxembourg, 22 présentent un solde migratoire interne moyen négatif entre 2013 et 2017 (cercles verts sur la carte). Cela signifie qu'en moyenne entre 2013 et 2017, ces communes présentent un bilan annuel négatif entre les entrées et sorties de résidents luxembourgeois en provenance ou à destination d'une autre commune luxembourgeoise. Les communes de Luxembourg (-2 359 personnes), Hesperange (-152) et Strassen (-102) présentent les soldes annuels moyens les plus faibles. Les autres 80 communes se caractérisent néanmoins par un solde migratoire interne moyen positif (cercles bleus sur Carte 22). Dans les communes de Differdange (213 personnes par an), Schifflange (194) et Pétange (166) la différence annuelle moyenne entre le nombre de résidents luxembourgeois s'installant dans la commune et le nombre de résidents luxembourgeois quittant la commune est maximale. <p>Définitions:</p> <p>Par solde migratoire moyen, on entend la différence entre le nombre de personnes qui entrent dans une zone géographique donnée et le nombre de personnes qui en sont sorties au cours d'une période déterminée.</p> <p>Dans la migration interne, seuls les changements de résidence à l'intérieur du pays sont pris en compte. La migration interne analyse la mobilité à l'intérieur du pays, entre les différentes zones administratives (cantons, communes, localités, etc.). Les migrations en provenance ou à destination de l'étranger ne sont pas considérées.</p> <p>Le taux de solde migratoire interne moyen pour la période 2013-2017 est le ratio entre le solde migratoire interne moyen de la période 2013-2017 rapporté à la population moyenne de la période 2013-2017. Le taux de solde migratoire interne est exprimé pour mille habitants.</p>
-
The percentage of analysis in which the parameter escherichia coli meets the threshold value
-
The percentage of analysis in which the parameter enterococci meets the threshold value
-
-
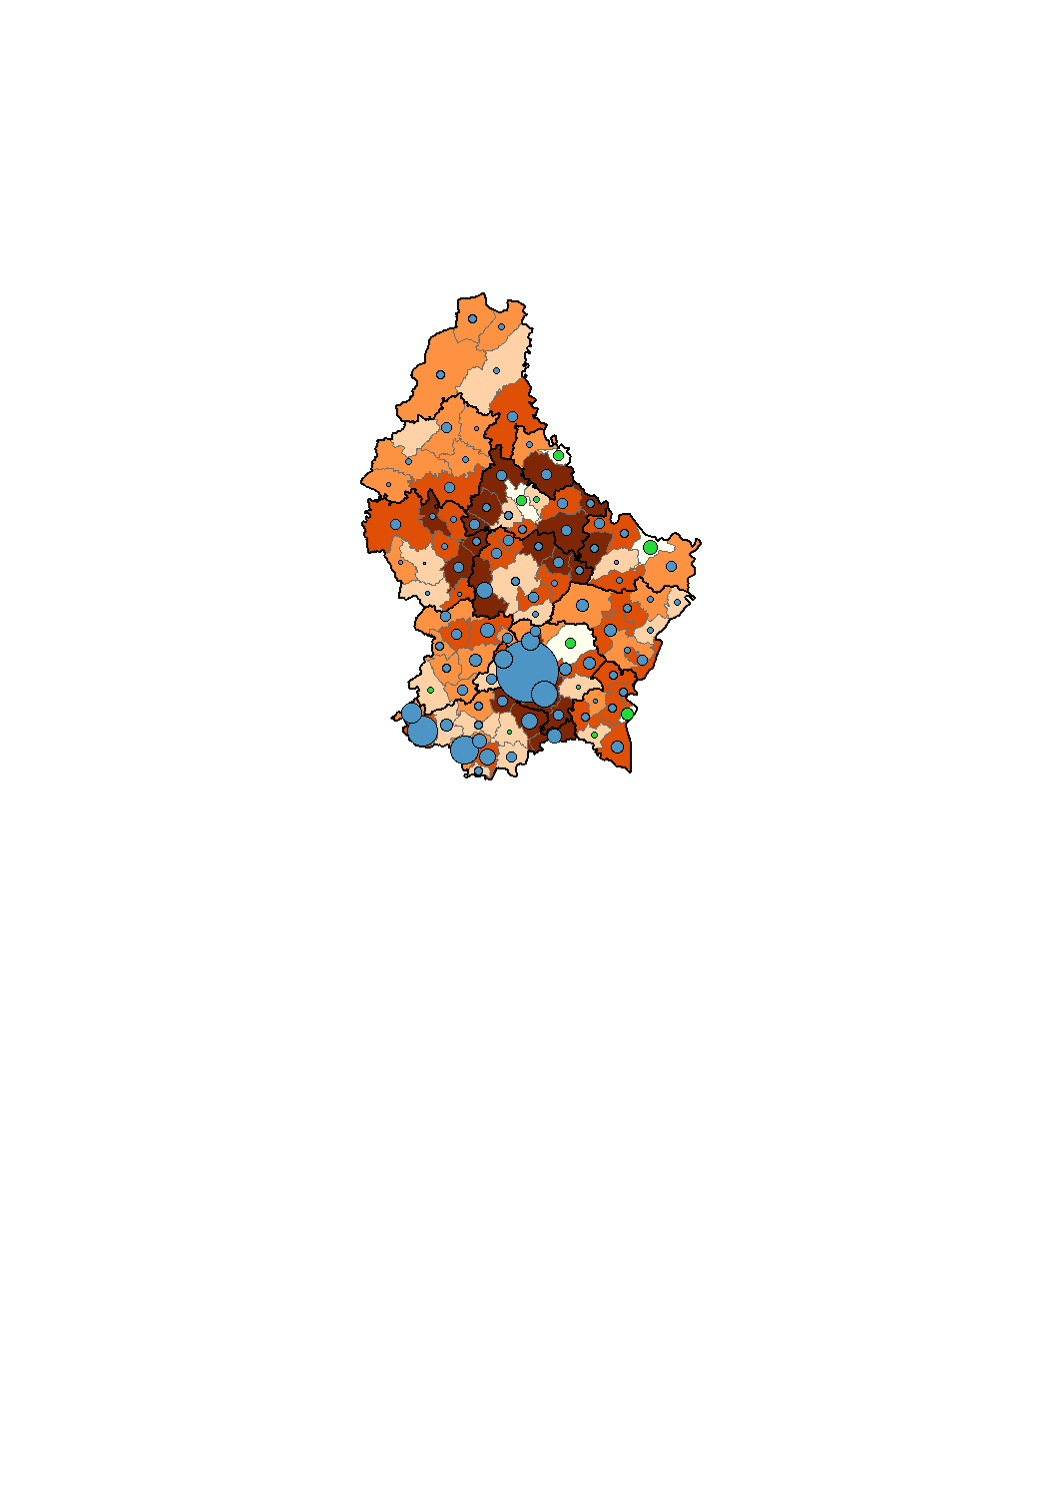
Le solde naturel, c'est-à-dire la différence entre le nombre de naissances et le nombre de décès, est relativement faible au Luxembourg. Entre 2013 et 2017, le solde naturel moyen était de 2 130 personnes. La majorité des communes présentent un solde moyen positif (cercles bleus sur la carte) entre 2013 et 2017. Luxembourg, Differdange et Esch-sur-Alzette connaissent les soldes naturels moyens les plus élevés, avec un excédent naturel moyen respectivement de 603, 133 et 126 personnes. Néanmoins, 11 communes, dont Echternach (-21), Remich (-16) et Niederanven (-12) se caractérisent par un solde naturel moyen négatif (cercles verts sur la carte). En ce qui concerne le taux de solde naturel moyen entre 2013 et 2017, il varie fortement d'une commune à l'autre en fluctuant entre -5.3% à Vianden et 10.8% à Helperknapp. La moyenne nationale est de 3.7%. Les 11 communes qui présentent un solde naturel moyen négatif présentent évidemment aussi un taux de solde naturel moyen inférieur à 0%. La Carte 21 montre que les hauts taux de solde naturel moyen s'observent surtout dans les communes au sud/sud-est de la Ville de Luxembourg et dans la plupart des communes au centre-nord et nord-est du pays. <p>Définitions:</p> <p>Le solde naturel moyen est la différence entre le nombre de naissances de la période 2013-2017 et le nombre de décès de la période 2013-2017.</p> <p>Le taux de solde naturel/taux de variation naturelle est le ratio entre le solde naturel moyen de la période 2013-2017 rapporté à la population moyenne de la période 2013-2017. Le taux de solde naturel est exprimé pour mille habitants.</p>
-

This layer contains the regulations contained in the land use plan of the municipality of Lintgen. The information in this geoportal layer has no legal value and must be considered as mere indications related to the original document. The original plan can be viewed in the local administration.