 geocatalogue.geoportail.lu
Energy
Type of resources
Available actions
Topics
Keywords
Contact for the resource
Provided by
Groups
Years
Representation types
Update frequencies
status
Scale
-
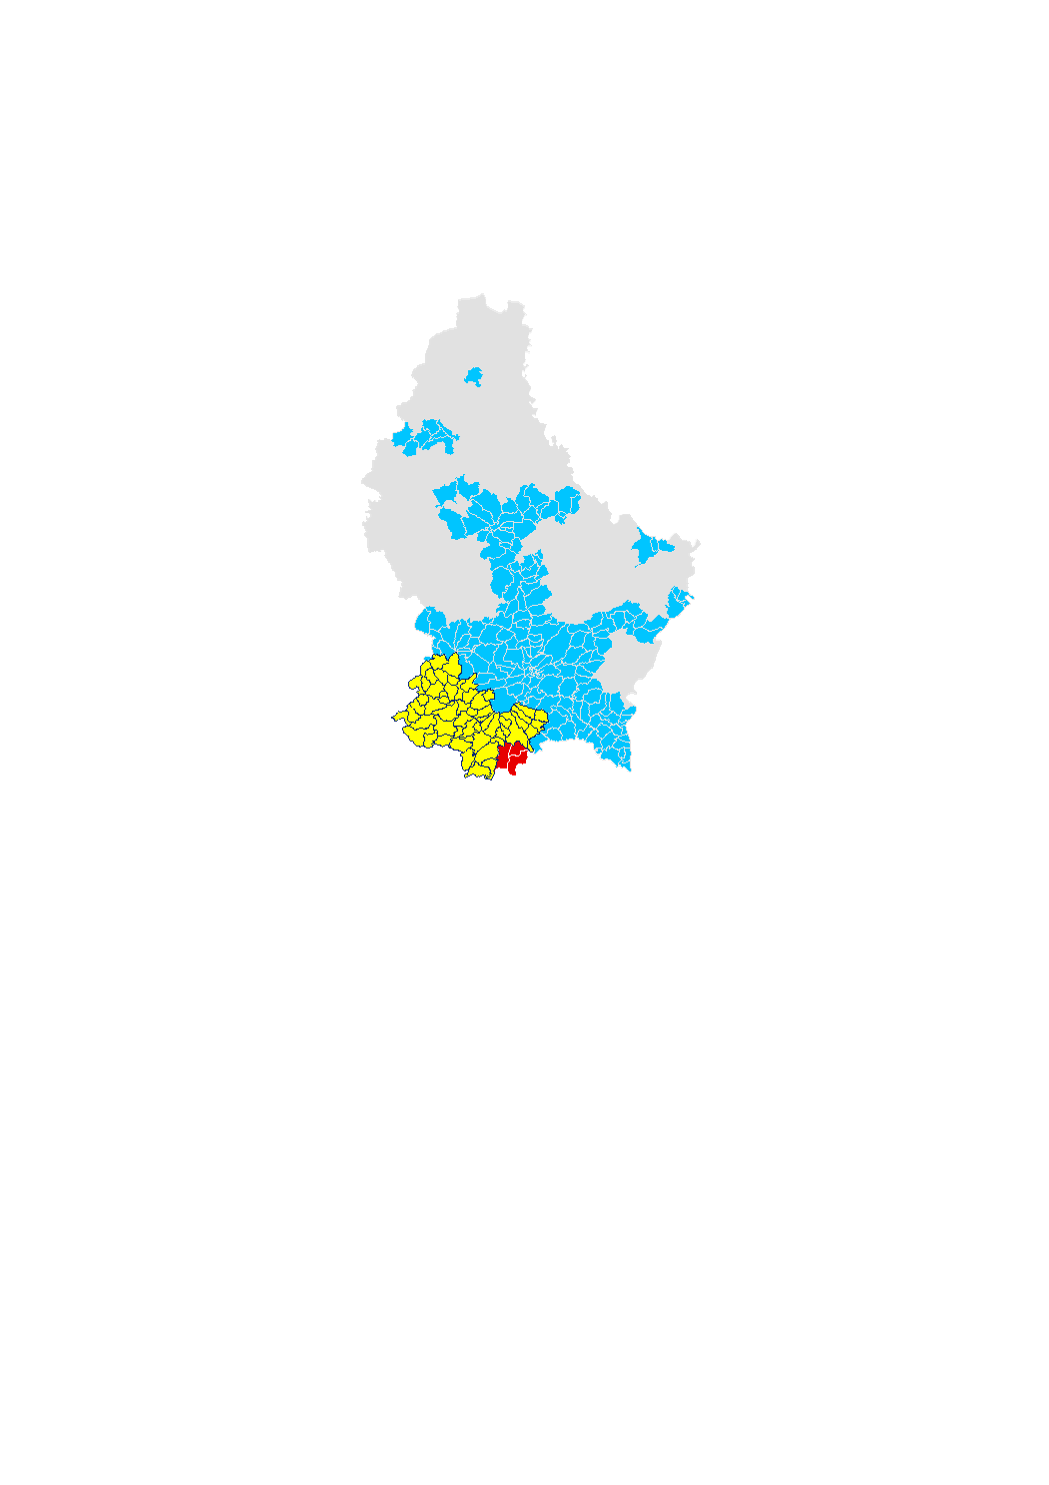
This layer gives an indication about the disponibility of natural gas for a given parcel. In a small scale, the cadastral sections are colorized according to the grid operator active in that cadastral section. This can be either Creos, Sudenergie or Dudelange city. In a bigger scale, cadastral parcels are colorized according to the fact that there is a gaz pipe ini a radius of 20m around the parcel. We make a difference between active pipes, inactive pipes (pipes present, but not yet under pressure) and the non presence of pipes. For further information about a given parcel, you can click into the map to get the contact details of the grid operator and send a prefilled email directly from the site.
-

<p>The solar radiation layers are simulations of solar radiation based on the Digital Surface Model. The simulation considers the topographic situation (surrounding, slope, exposition) as well as time-based variation of the sun radiation for a specific geographic location. The result is a raster visualization of the sun duration per pixel (with 1 m ground resolution). The simulation is configured to return the sun hours per pixel for a given day. Currently 3 days were calculated: 15/02 (winter), 15/05 (spring) and 15/08 (summer).</p> <p>The solar radiation analysis is based on the solar radiation toolset of the ESRI ArcMap toolbox. A detailed documentation can be found in the corresponding documentation by ESRI: http://desktop.arcgis.com/en/arcmap/10.6/tools/spatial-analyst-toolbox/area-solar-radiation.htm </p> <a href="http://desktop.arcgis.com/en/arcmap/10.6/tools/spatial-analyst-toolbox/area-solar-radiation.htm">ESRI Documentation</a> <p>The analysis used the following parameters: </p> <p> - Input raster: Digital Surface model provided by the Administration de la navigation aérienne (ANA) based on a LiDAR flight from 2017. (DSM available here : https://data.public.lu/fr/datasets/digital-surface-model-high-dem-resolution/ )</p> <p> - Latitude : 49.46 °</p> <p> - Time configuration : Time Within a day (for 3 dates: 15/02 winter, 15/05 spring and 15/08 summer)</p> <p> - Hour interval: 0.5 The solar radiation was calculated in 30 min. intervals and summed up per day.</p> <p> - Slope and aspect input : The slope and aspect rasters are calculated from the input digital surface model</p> <p> - Calculation directions: 32, which is adequate for a complex topography.</p> <p> - Diffuse proportion : 0.3 for a generally clear sky conditions. </p> <p> - Transmittitivity : 0.5 for a generally clear sky.</p> <p> - Output raster: The result is an output raster representing the duration of direct incoming solar radiation.</p>
-

This layer shows the rooftops with a potential of over 30 kWp The suitability for photovoltaics is expressed in the following categories: 0: unsuitable, 7: conditionally suitable, 1: suitable, 2: well suitable Attention: with negative values, the potential could not be determined! The maximum installable system size as well as the maximum power yield are estimated on the basis of 270Wp modules with dimensions of 0.990x1.650m.
-
This layer shows the possible category of the feed-in tariff, based on the maximal possible power The suitability for photovoltaics is expressed in the following categories: 0: unsuitable, 7: conditionally suitable, 1: suitable, 2: well suitable Attention: with negative values, the potential could not be determined! The maximum installable system size as well as the maximum power yield are estimated on the basis of 270Wp modules with dimensions of 0.990x1.650m.
-
This layer shows the potential solar radiation on a rooftop. The suitability for photovoltaics is expressed in the following categories: 0: unsuitable, 7: conditionally suitable, 1: suitable, 2: well suitable Attention: with negative values, the potential could not be determined! The maximum installable system size as well as the maximum power yield are estimated on the basis of 270Wp modules with dimensions of 0.990x1.650m.
-
<p>The solar radiation layers are simulations of solar radiation based on the Digital Surface Model. The simulation considers the topographic situation (surrounding, slope, exposition) as well as time-based variation of the sun radiation for a specific geographic location. The result is a raster visualization of the sun duration per pixel (with 1 m ground resolution). The simulation is configured to return the sun hours per pixel for a given day. Currently 3 days were calculated: 15/02 (winter), 15/05 (spring) and 15/08 (summer).</p> <p>The solar radiation analysis is based on the solar radiation toolset of the ESRI ArcMap toolbox. A detailed documentation can be found in the corresponding documentation by ESRI: http://desktop.arcgis.com/en/arcmap/10.6/tools/spatial-analyst-toolbox/area-solar-radiation.htm </p> <a href="http://desktop.arcgis.com/en/arcmap/10.6/tools/spatial-analyst-toolbox/area-solar-radiation.htm">ESRI Documentation</a> <p>The analysis used the following parameters: </p> <p> - Input raster: Digital Surface model provided by the Administration de la navigation aérienne (ANA) based on a LiDAR flight from 2017. (DSM available here : https://data.public.lu/fr/datasets/digital-surface-model-high-dem-resolution/ )</p> <p> - Latitude : 49.46 °</p> <p> - Time configuration : Time Within a day (for 3 dates: 15/02 winter, 15/05 spring and 15/08 summer)</p> <p> - Hour interval: 0.5 The solar radiation was calculated in 30 min. intervals and summed up per day.</p> <p> - Slope and aspect input : The slope and aspect rasters are calculated from the input digital surface model</p> <p> - Calculation directions: 32, which is adequate for a complex topography.</p> <p> - Diffuse proportion : 0.3 for a generally clear sky conditions. </p> <p> - Transmittitivity : 0.5 for a generally clear sky.</p> <p> - Output raster: The result is an output raster representing the duration of direct incoming solar radiation.</p>
-

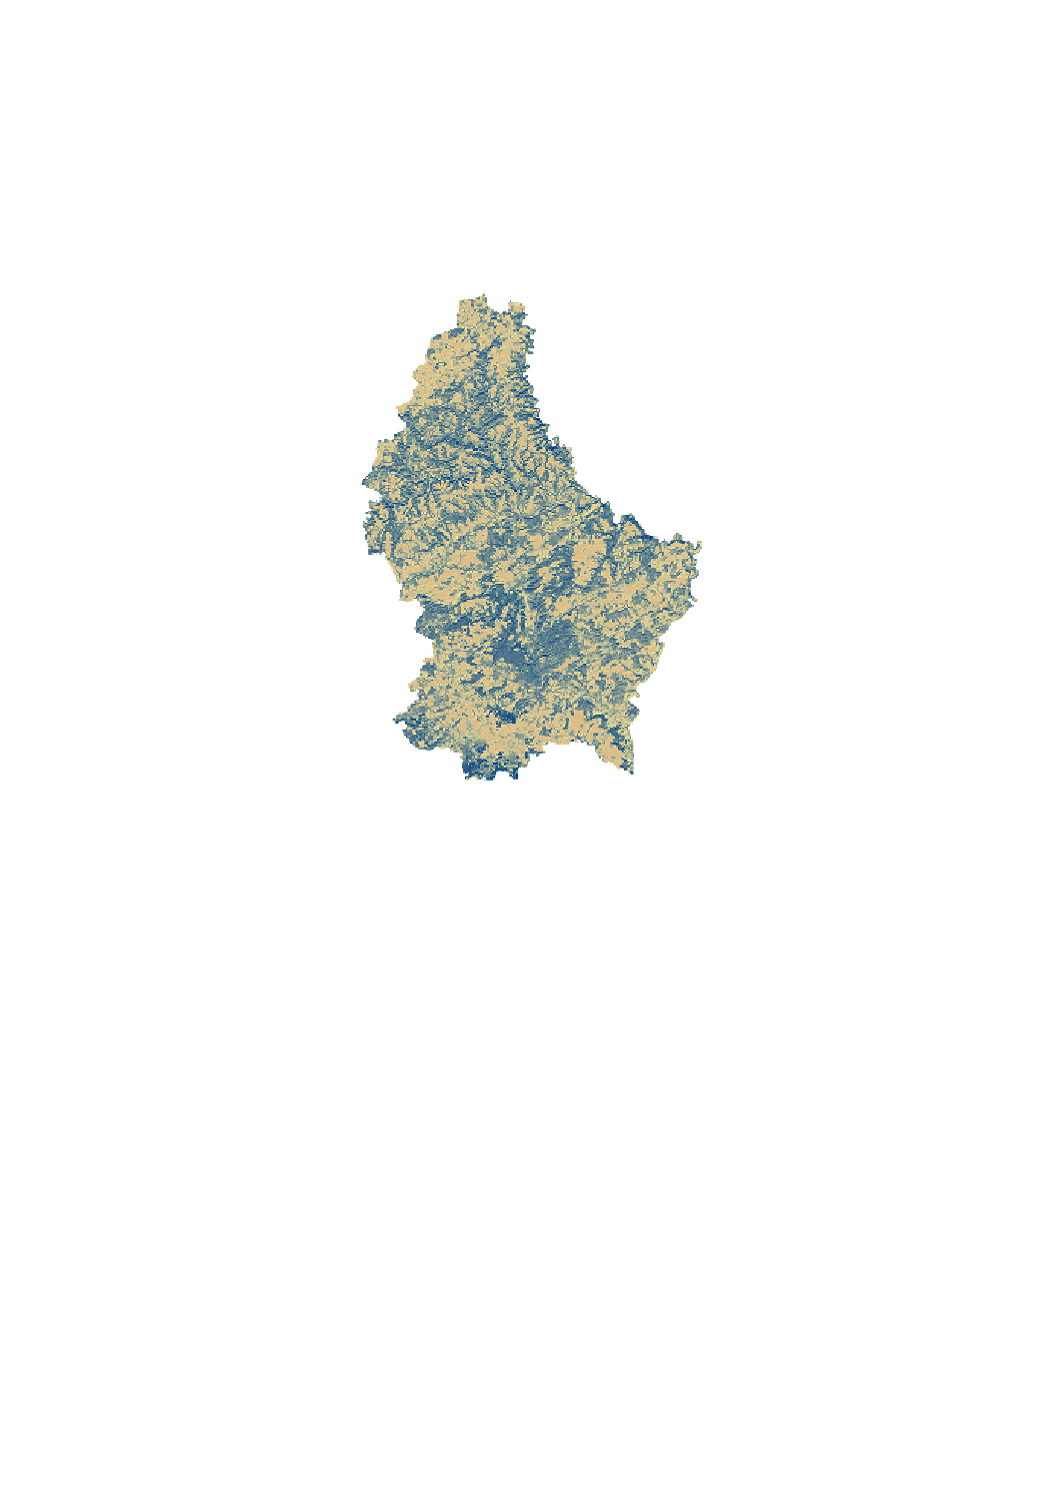
The map identifies areas according to the number of hours of sunshine per day. We will consider a shaded area with less than 3 hours of sunshine per day, half-shade between 3 hours and 6 hours and sunny with more than 6 hours per day.
-
This layer contains the locations of public charging stations for electric cars and hybrid plug-in vehicles. Information about availability is shown in real-time. Blue dot = available Green dot = occupied
-
The present location map shows the distribution of wind turbines authorized by the Minister of the Environment under the legislation on classified establishments. Depending on the data availability, information on the installed power, hub height and diameter of the propeller can be consulted. "Autorisé" is the project of a wind turbine that has been authorized under the legislation on classified establishments, while "existant" is a wind turbine built by the constructor and according to the implementation report. It should be noted that the coordinates of existing wind turbines listed in the authorization files do not always correspond exactly to the coordinates of the actual locations of the wind turbines after construction, and may vary slightly depending on the construction. Where applicable, the coordinates of wind turbines validated by an official surveyor are indicated by an attribute.
-
This layer contains the addresses from the official address data set created and managed by the Administration du Cadastre et de la Topographie (ACT). The street names correspond to the official national street names and town name register, the Registre National des Localités et des Rues (CACLR), which is also managed by ACT. The address points are placed in the respective centres of the largest building or of the parcel.