 geocatalogue.geoportail.lu
TIFF
Type of resources
Available actions
Topics
Provided by
Groups
Years
Formats
Representation types
Update frequencies
status
Scale
-
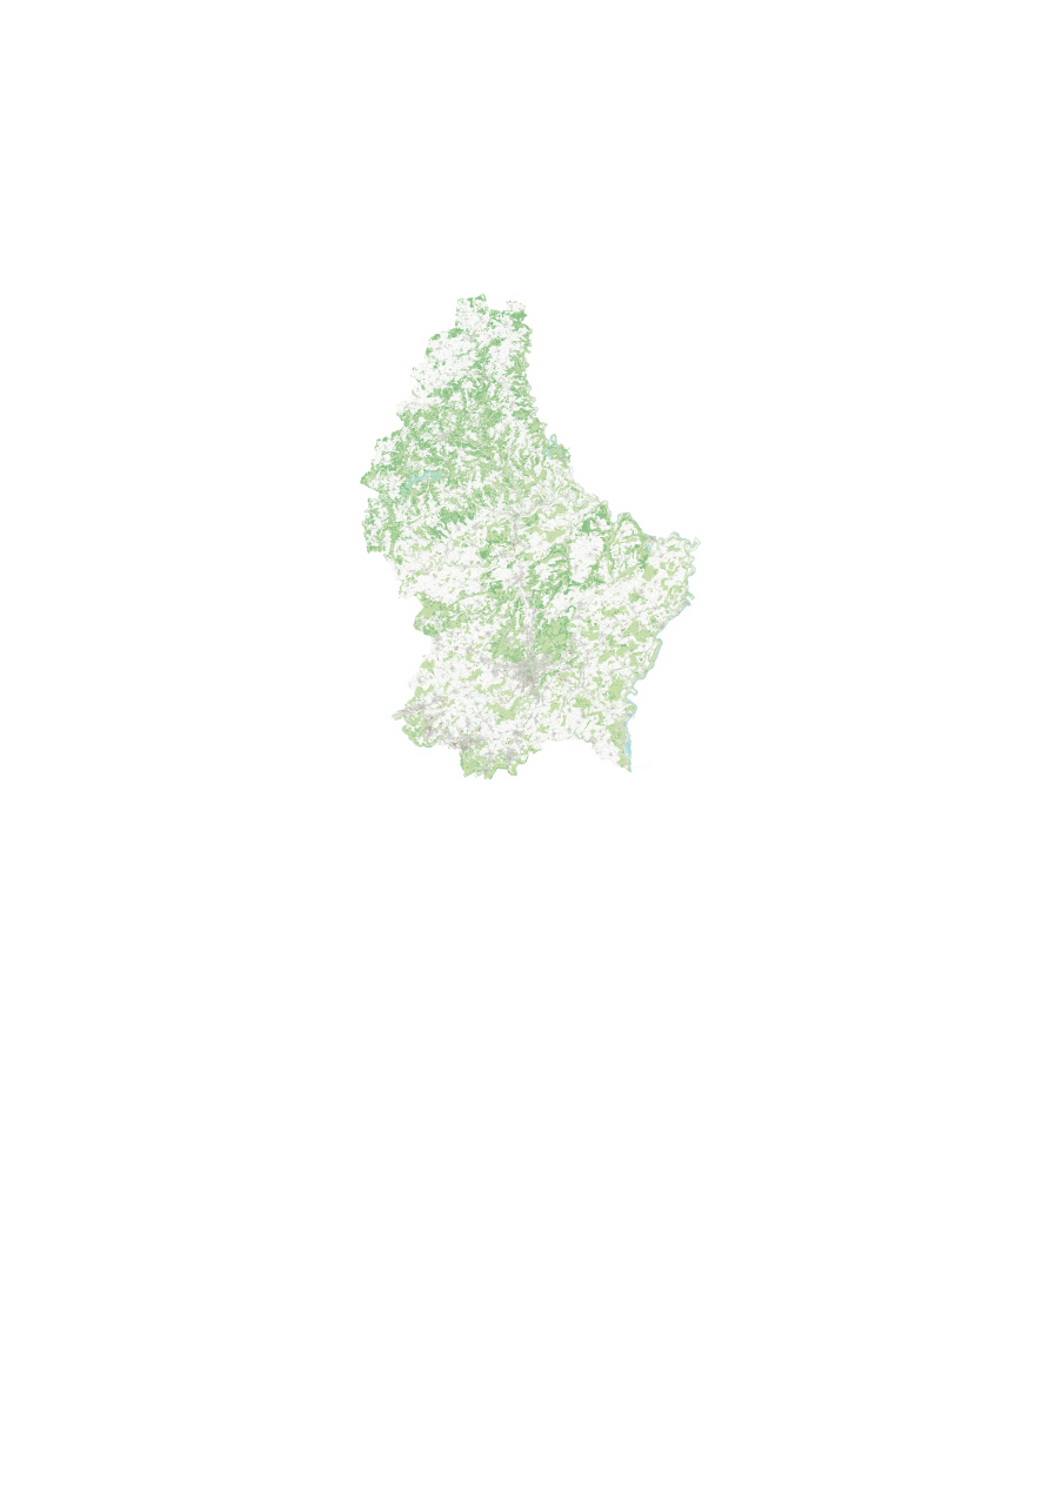
The digital topographic map 1:5000 is a graphic rendering of the digital topographic database BD-L-TC. The territory is divided in 261 map sheets of 3km x 4km.
-
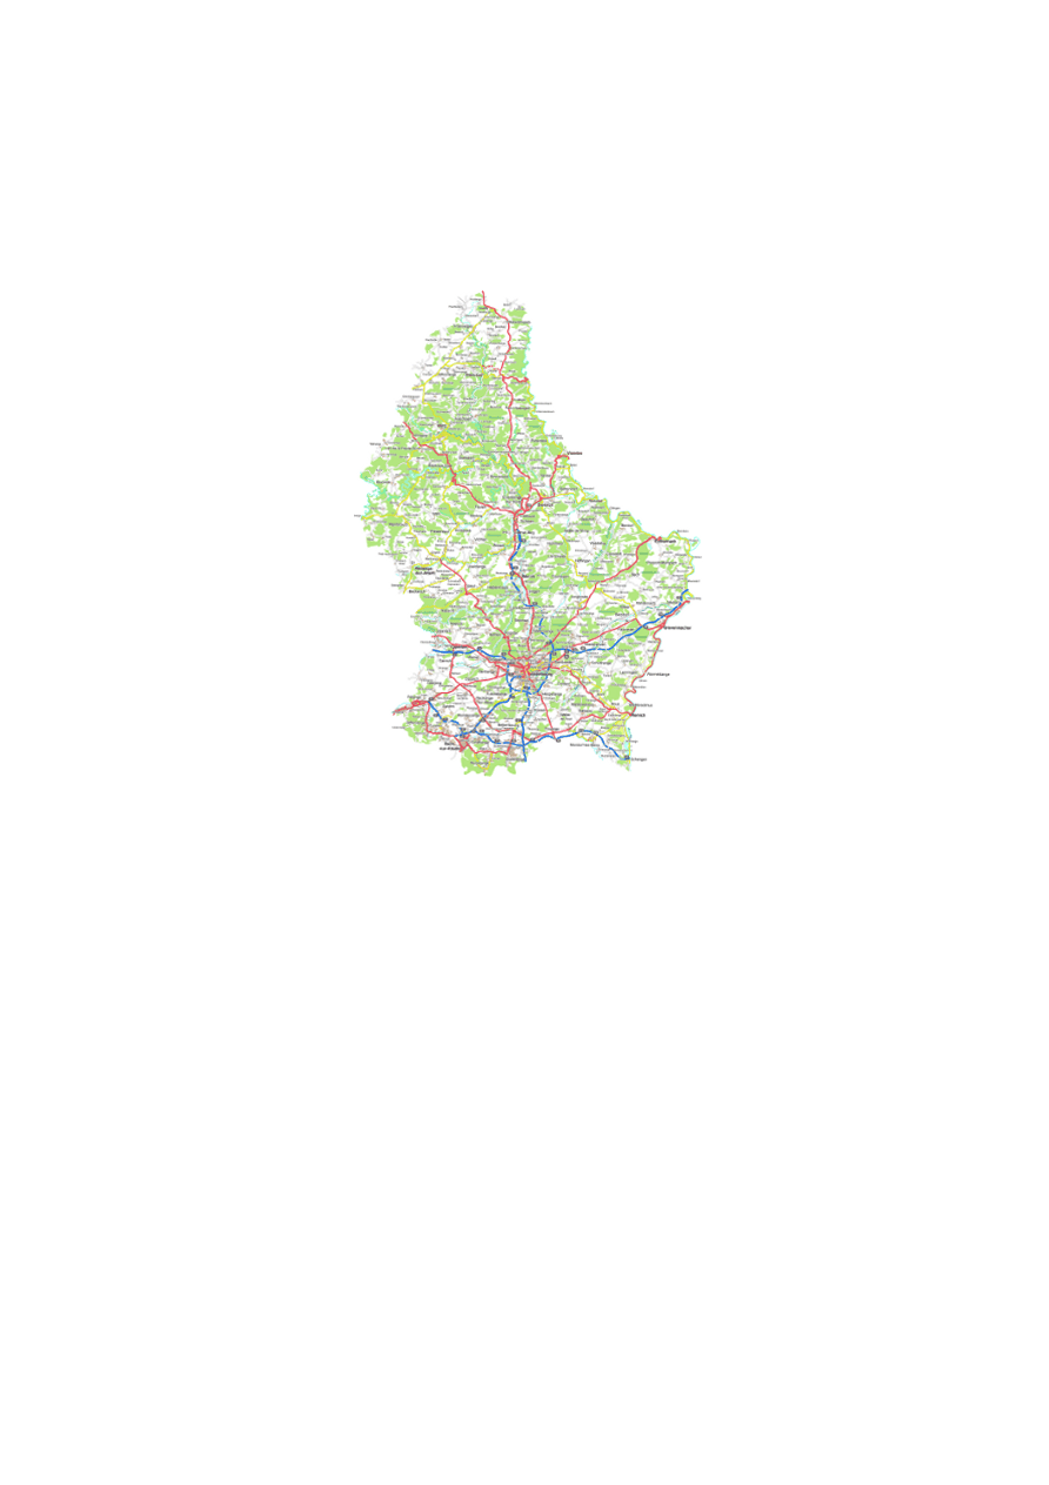
Digital topographic map.
-
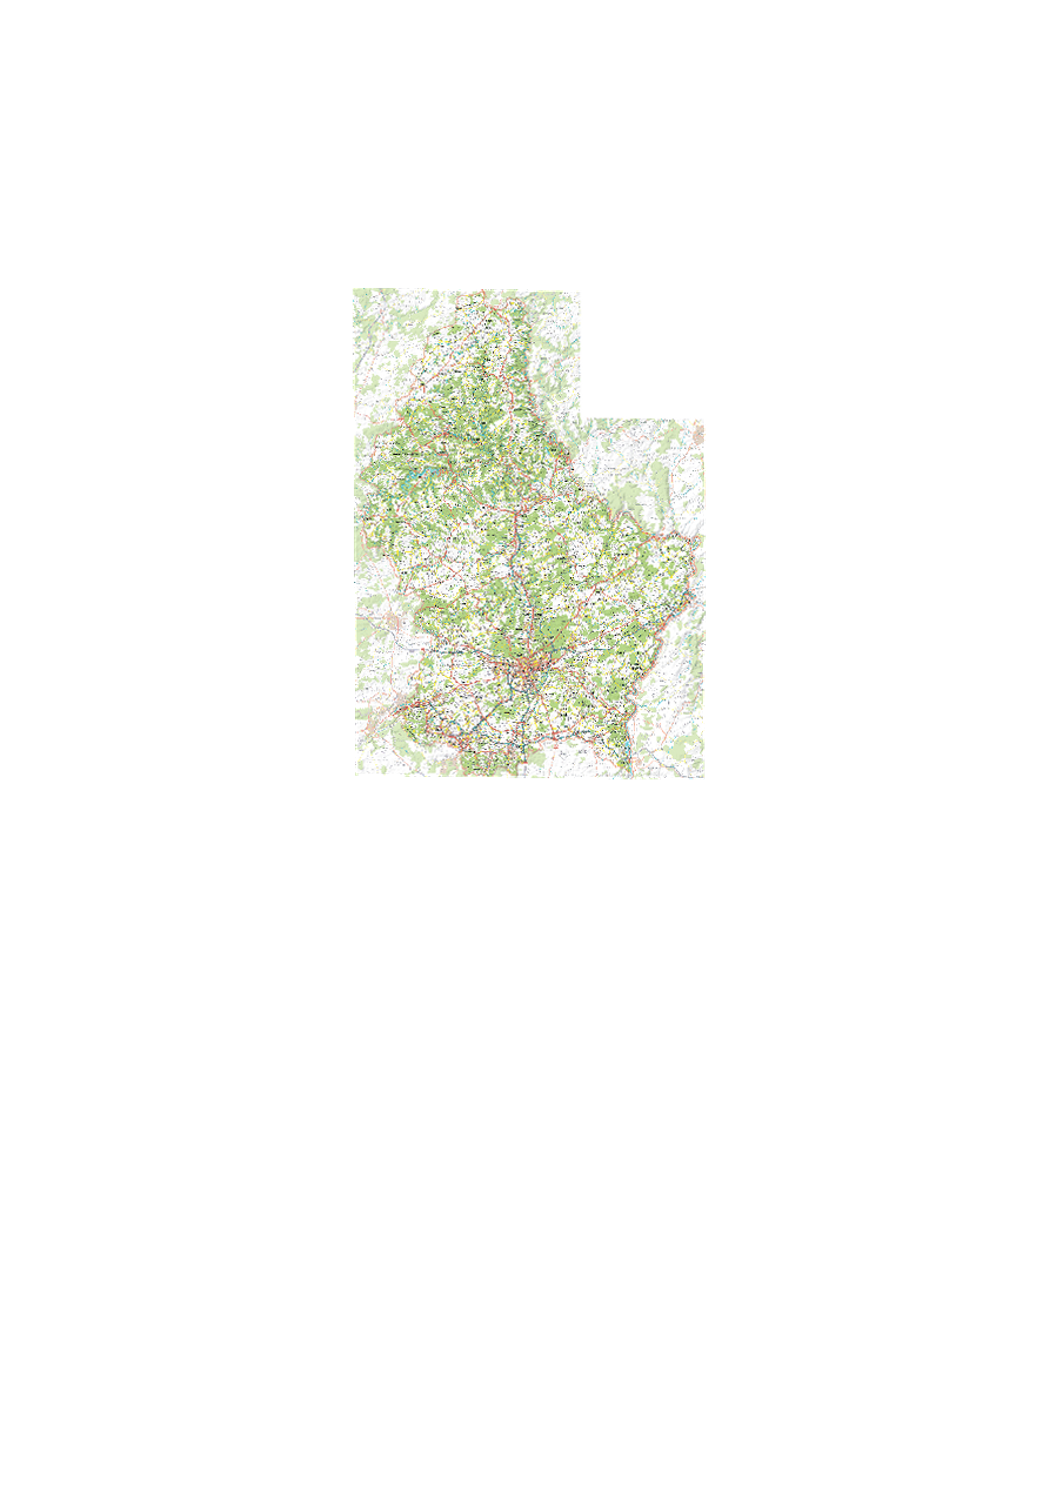
Digital topographic map at scale 1:50.000 issued from the BD-L-TC. Exists as rasterfile (TIFFormat) as well as vector-database, including a style-file for ARCGIS.
-
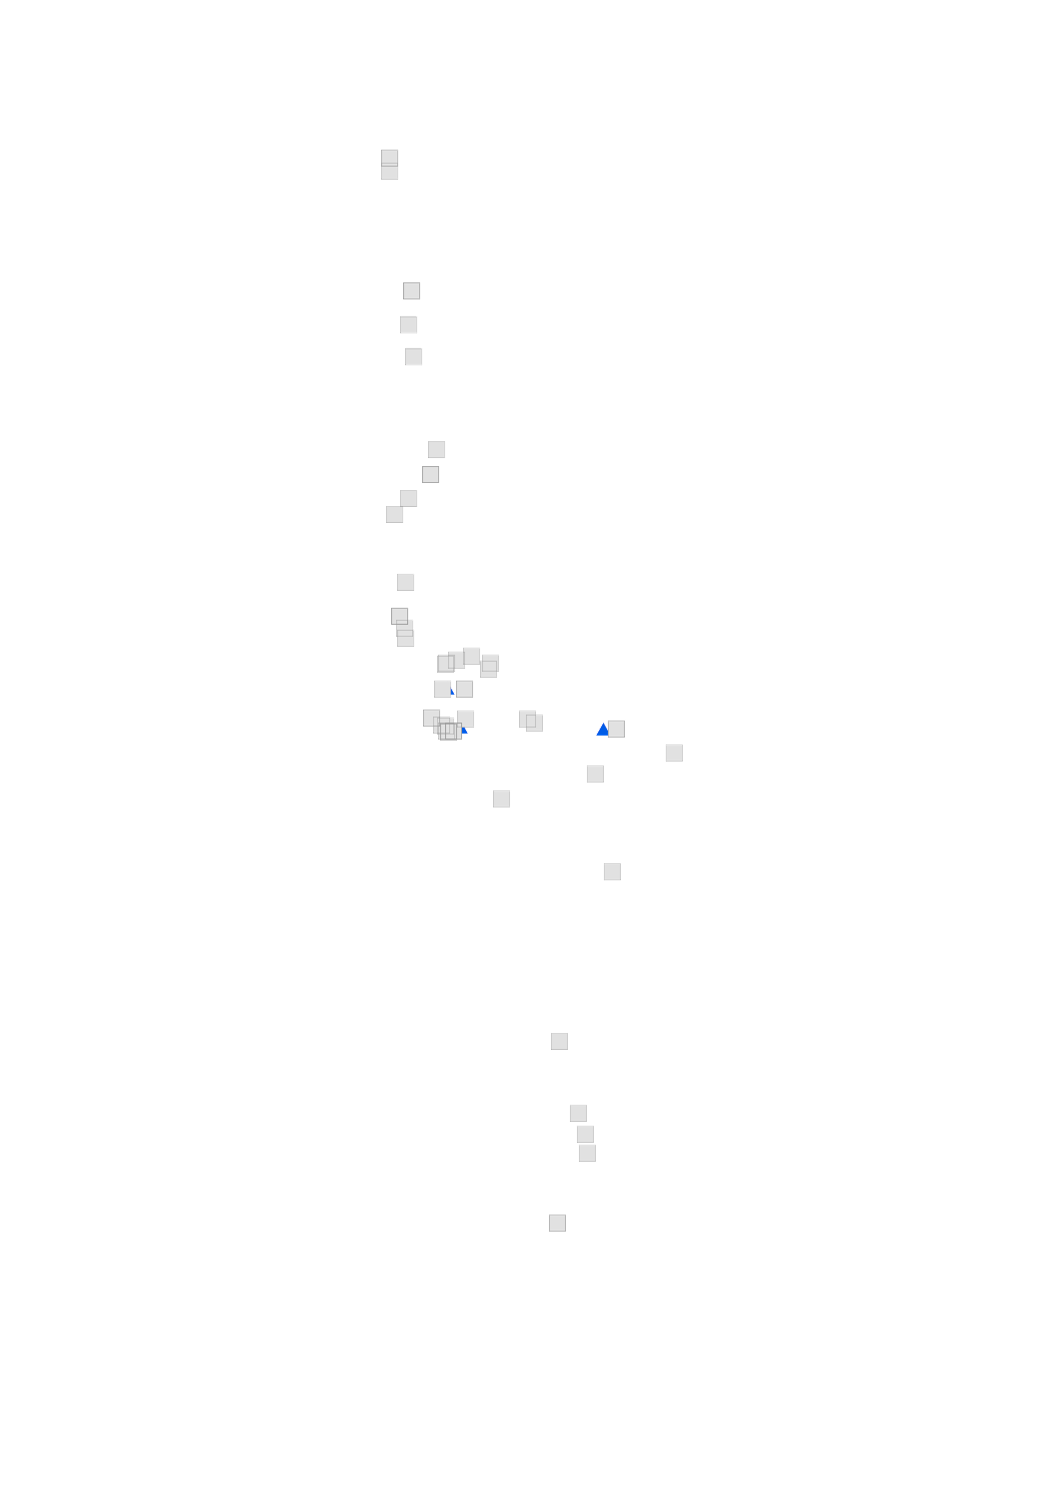
These are buildings that are crossing the rivers (data available for the fifteen TIMIS rivers).
-
Layer showing the different hazard zones or degrees of danger which affect humans, animals and goods. The intensity and the frequency of 10-year, 50-year, 100-year, 200-year and extreme flood events are combined in a matrix in order to express the degree of danger: the stronger the intensity and the more often the event occurred, the stronger is the hazard. One distinguishes between high, medium, low and remaining hazard.
-
Layer showing the intensity of a modeled 100-year flood event. The intensity of a flood event depends on the water depth and the discharge.
-
Layer showing the intensity of a modeled 50-year flood event. The intensity of a flood event depends on the water depth and the discharge.
-
Layer showing the floodplain of an extreme modeled flood event
-
Layer showing the floodplain of a modeled 10-year flood event
-
Layer showing the water depth of a modeled extreme flood event