 geocatalogue.geoportail.lu
ShapefileTODO
Type of resources
Available actions
Provided by
Groups
Years
Formats
Representation types
Update frequencies
status
Scale
-
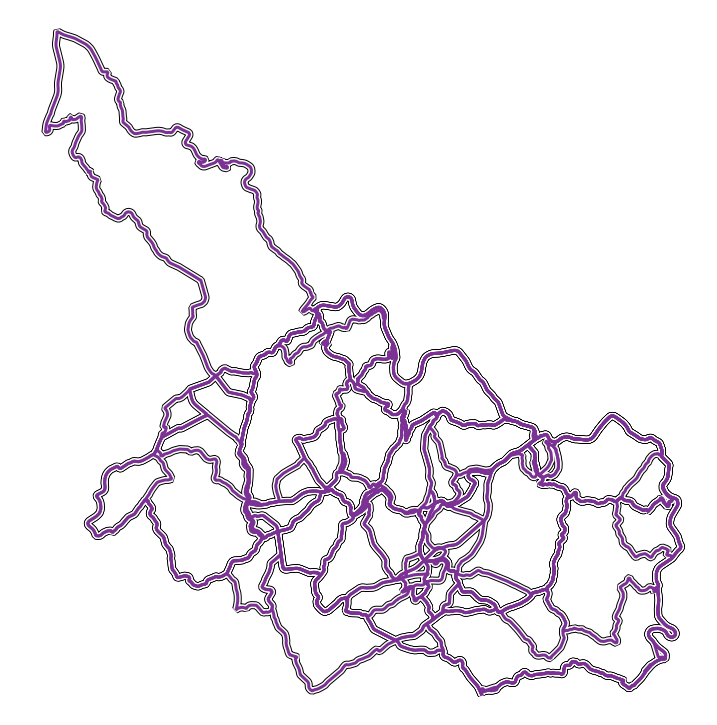
This layer contains tours suitable for road bikes. The tours are not signposted. There is an online roadbook.
-
This layer contains bike rental stations.
-
This layer contains touristic cycle tours, such as the Tudor Tour or the Dällchen West Tour.
-
This layer contains marked mountain bike trails with different levels of difficulty.
-

This layer contains bike routes of the neighboring countries that connect to the bike route networks of Luxembourg.
-
Slow Cycling Guttland tours are unmarked, GPS-based cycling routes starting from fixed locations (e.g. Useldange or Kleinbettingen) following quiet roads and paths through culturally and naturally rich landscapes.
-
This layer contains all nature & geology trails.
-
This layer contains the events of the FLMP/ IVV (Fédération luxembourgeoise de la marche populaire).
-

This layer contains the permanent hiking trails of the FLMP/ IVV (Fédération luxembourgeoise de la marche populaire).
-

This layer contains the Luxembourg part of the Liberation Route Europe.