 geocatalogue.geoportail.lu
Type of resources
Available actions
Topics
Provided by
Groups
Years
Formats
Representation types
Update frequencies
status
Scale
-
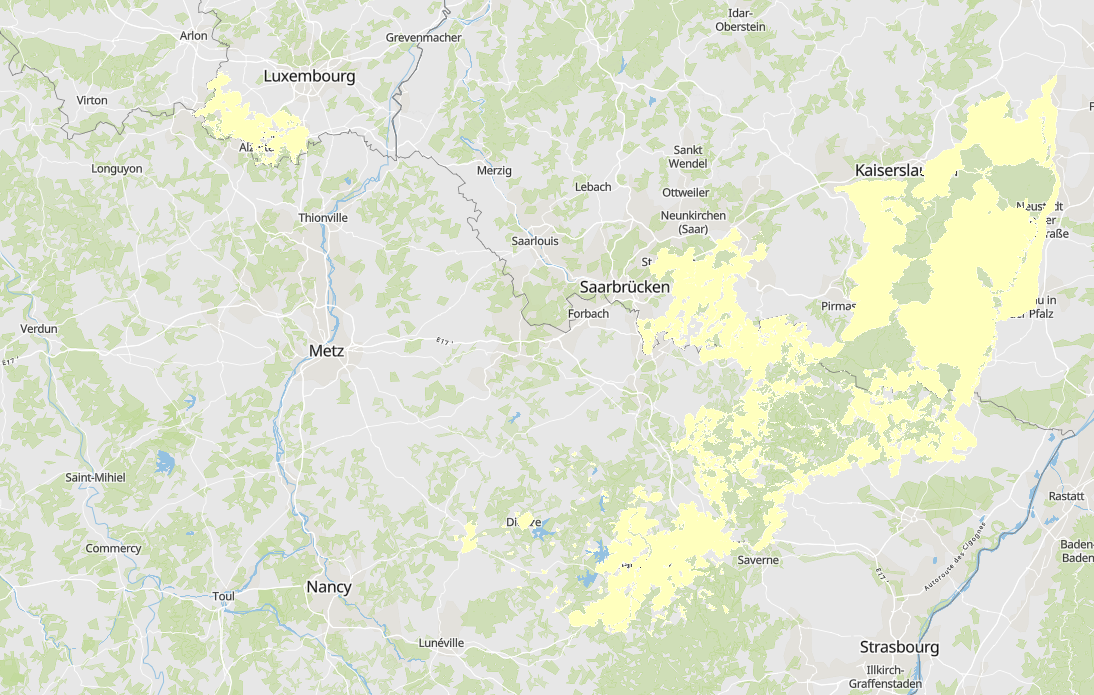
Biosphere reserves in 2022: buffer zones - Data sources: Ministère de l’Environnement, du Climat et du Développement durable (LU), Ministère de l’Énergie et de l’Aménagement du territoire (LU), Biosphärenzweckverband, LVGL, Ministerium für Umwelt und Verbraucherschutz Saarland, Parc naturel régional des Vosges du Nord, Naturschutzverwaltung Rheinland-Pfalz. Harmonization: SIG-GR / GIS-GR 2022
-
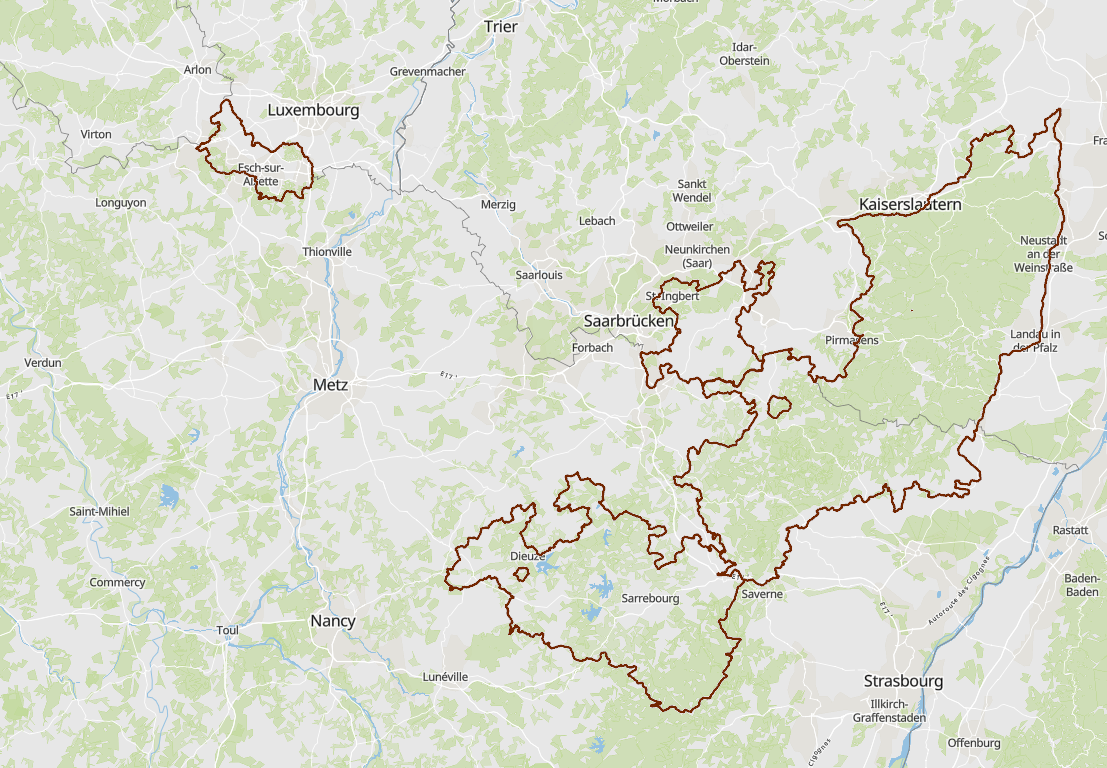
Biosphere reserves in 2022: delimitation - Data sources: Ministère de l’Environnement, du Climat et du Développement durable (LU), Ministère de l’Énergie et de l’Aménagement du territoire (LU), Biosphärenzweckverband, LVGL, Ministerium für Umwelt und Verbraucherschutz Saarland, Parc naturel régional des Vosges du Nord, Naturschutzverwaltung Rheinland-Pfalz. Harmonization: SIG-GR / GIS-GR 2022
-
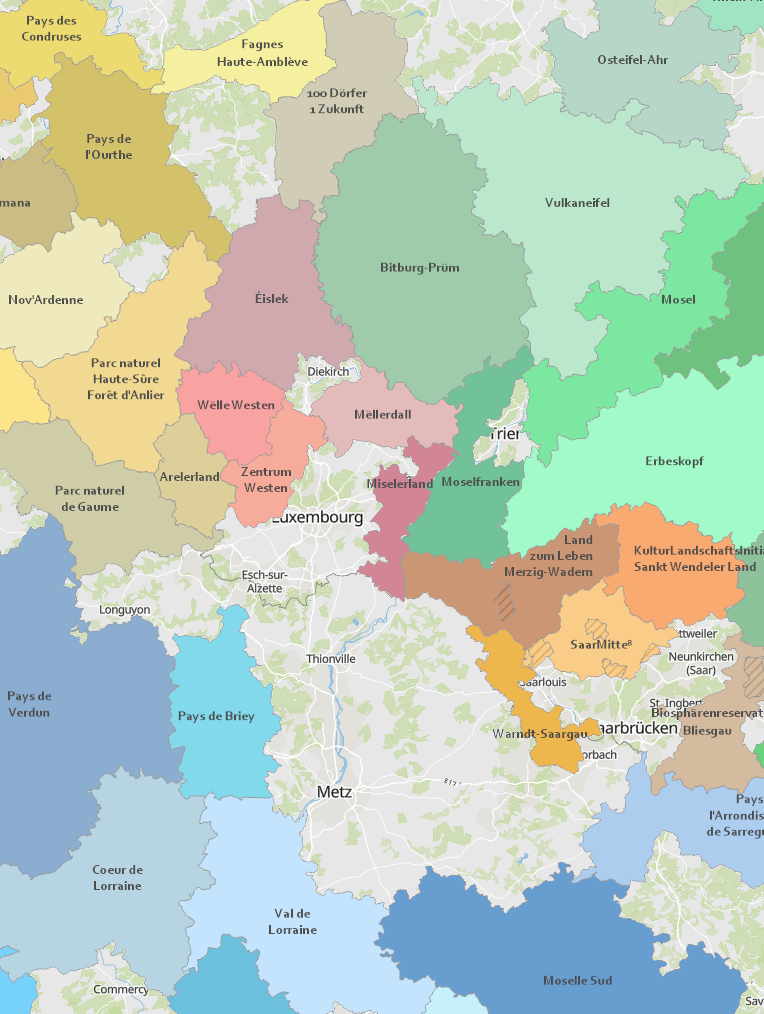
- LEADER Regions 2023-2027 - Data: LVermGeo Rheinland-Pfalz, Ministère de l'Agriculture, de l’Alimentation et de la Viticulture Luxembourg, Ministerium für Umwelt, Klima, Mobilität, Agrar und Verbraucherschutz Saarland, Région Grand Est, Réseau wallon PAC. Harmonization: GIS-GR 2024
-
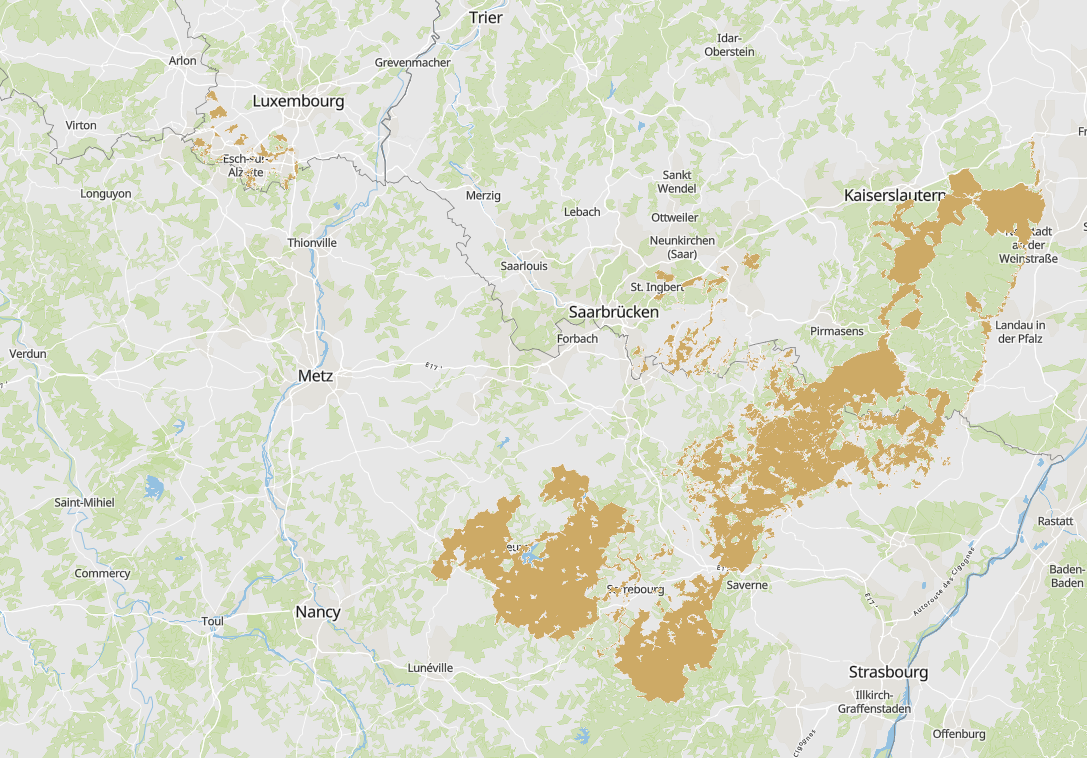
Biosphere reserves in 2022: transition zones - Data sources: Ministère de l’Environnement, du Climat et du Développement durable (LU), Ministère de l’Énergie et de l’Aménagement du territoire (LU), Biosphärenzweckverband, LVGL, Ministerium für Umwelt und Verbraucherschutz Saarland, Parc naturel régional des Vosges du Nord, Naturschutzverwaltung Rheinland-Pfalz. Harmonization: SIG-GR / GIS-GR 2022
-
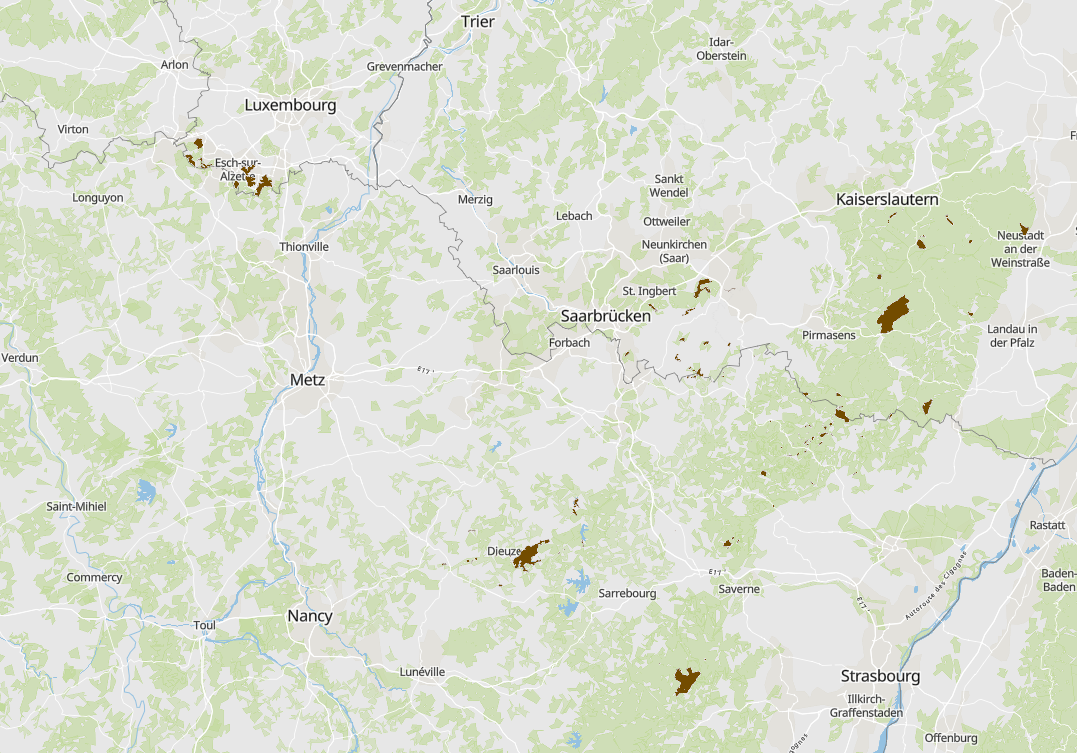
Biosphere reserves in 2022: core zones - Data sources: Ministère de l’Environnement, du Climat et du Développement durable (LU), Ministère de l’Énergie et de l’Aménagement du territoire (LU), Biosphärenzweckverband, LVGL, Ministerium für Umwelt und Verbraucherschutz Saarland, Parc naturel régional des Vosges du Nord, Naturschutzverwaltung Rheinland-Pfalz. Harmonization: SIG-GR / GIS-GR 2022
-
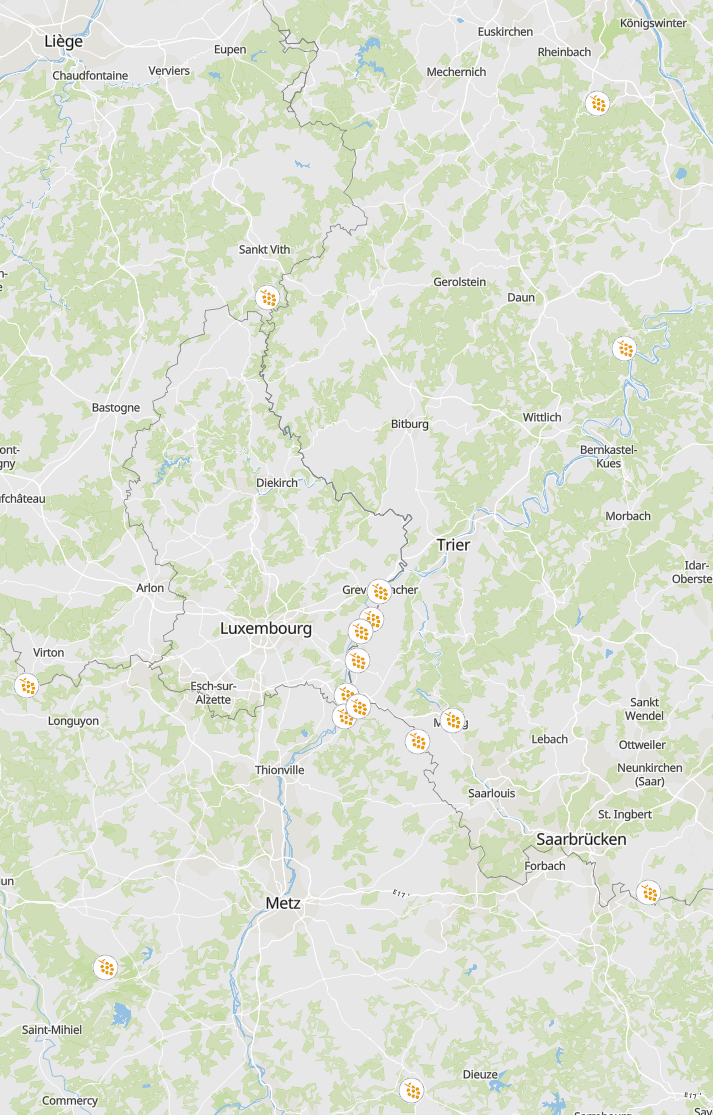
- Calendar 2024 of the Greater Region: wine and viticulture - Data: Working party Land registry and mapping of the Summit of the Greater Region: Harmonization: GIS-GR 2023
-
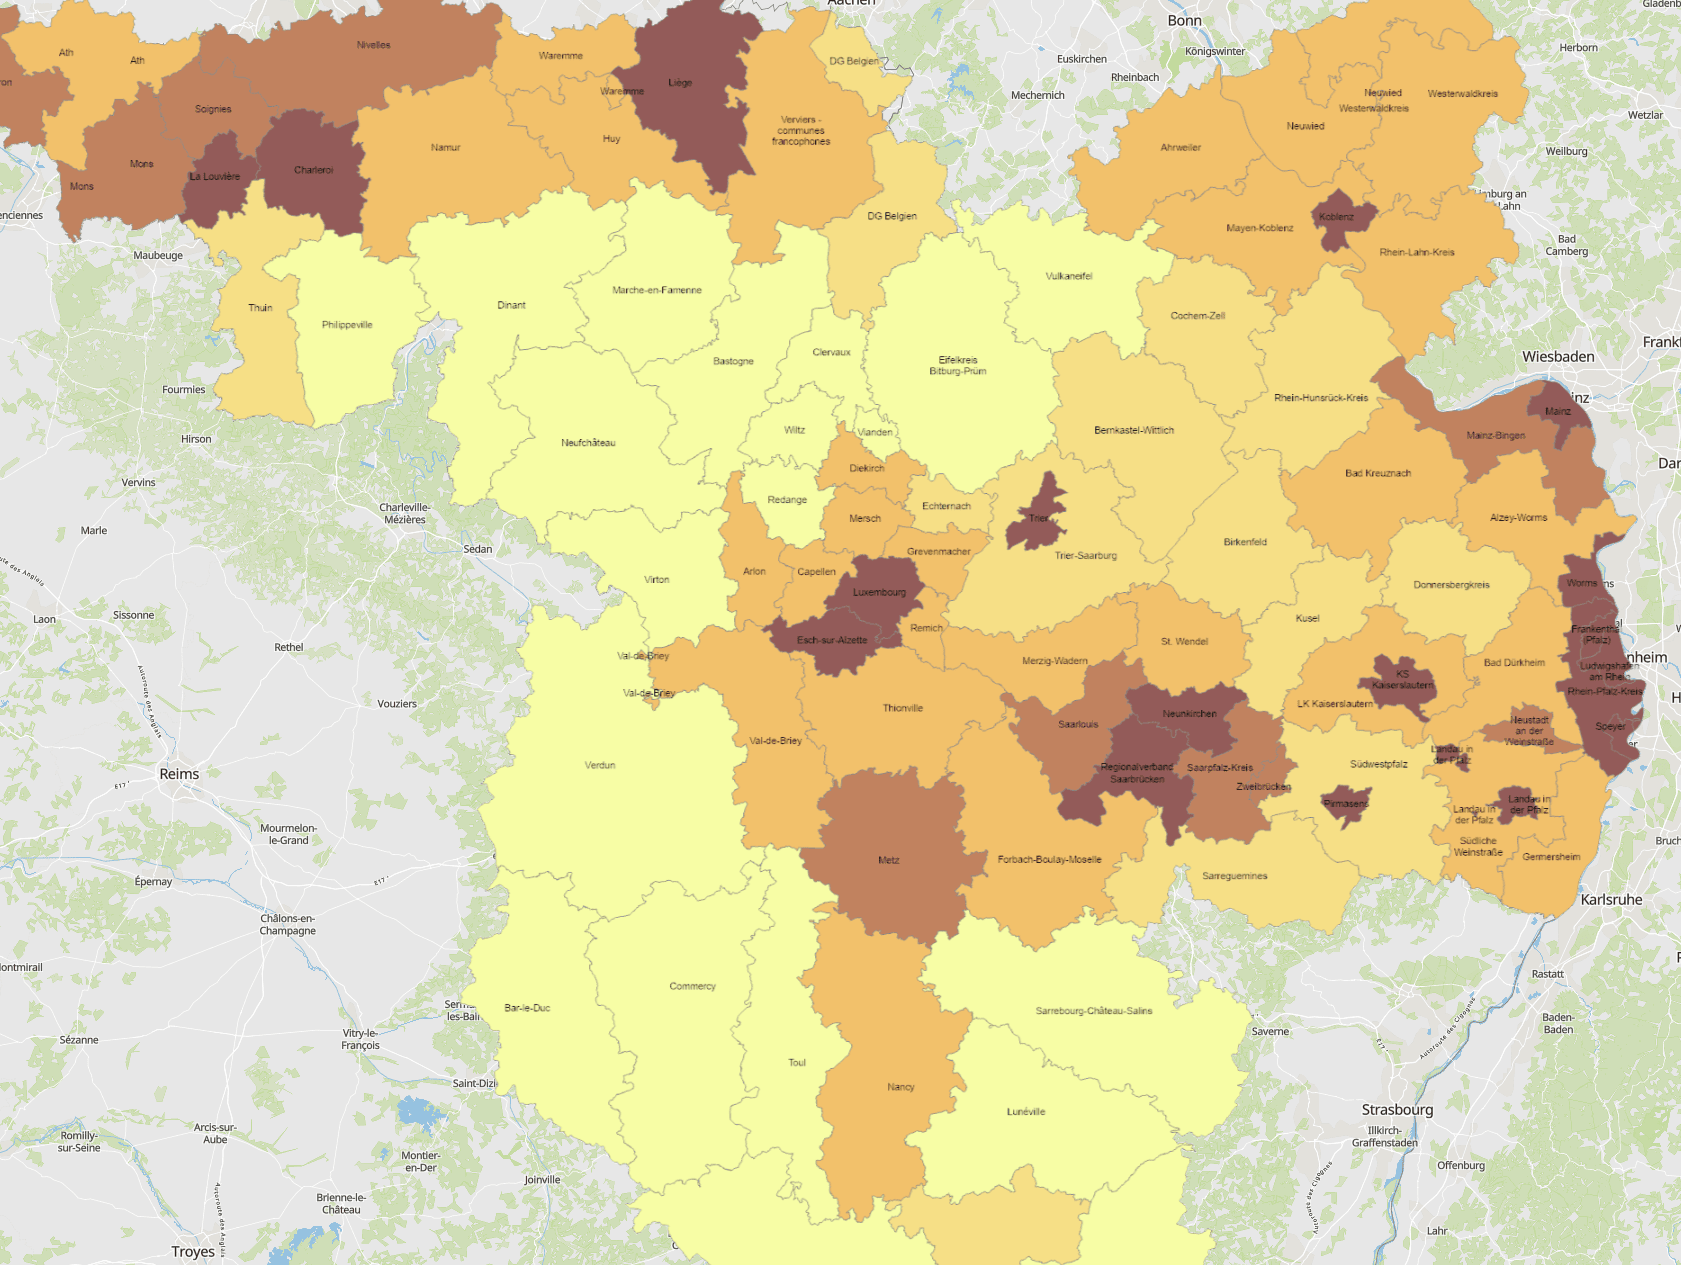
- Population density 2023 (inhabitants per km²), Lorraine: 2021 - Territorial entities: arrondissements (Lorraine, Wallonie), cantons (Luxembourg), Kreise (Saarland, Rheinland-Pfalz) - Statistical data sources: Destatis, INSEE, Statbel, STATEC. Harmonization: IBA / OIE 2024 - Geodata sources: GeoBasis-DE / BKG, IGN France, NGI-Belgium, ACT Luxembourg. Harmonization: SIG-GR / GIS-GR 2024
-
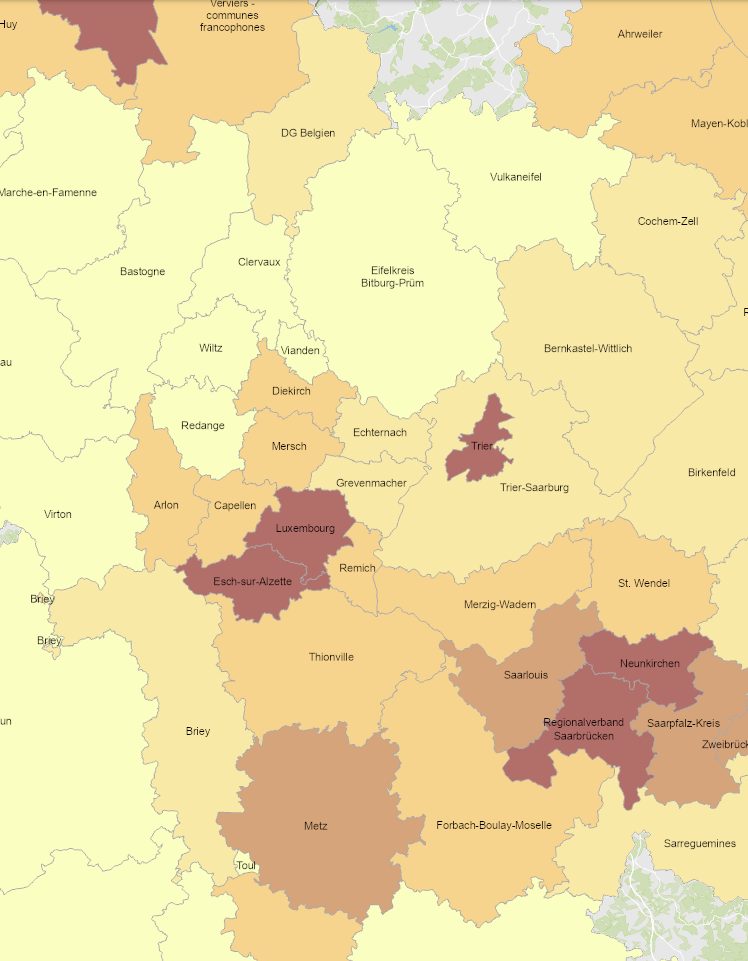
- Population density 2021 (inhabitants per km²), Lorraine: 2019 - Territorial entities: arrondissements (Lorraine, Wallonie), cantons (Luxembourg), Kreise (Saarland, Rheinland-Pfalz) - Statistical data sources: Destatis, INSEE, Statbel, STATEC. Harmonization: IBA / OIE 2022 - Geodata sources: GeoBasis-DE / BKG 2017, IGN France 2017, NGI-Belgium 2017, ACT Luxembourg 2017. Harmonization: SIG-GR / GIS-GR 2022
-
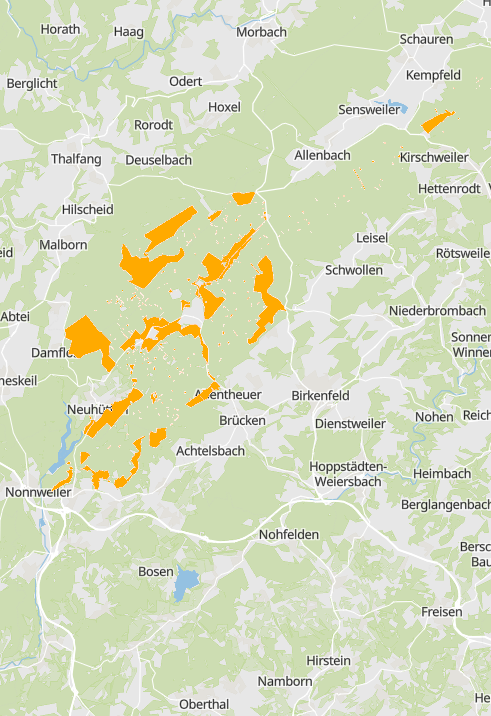
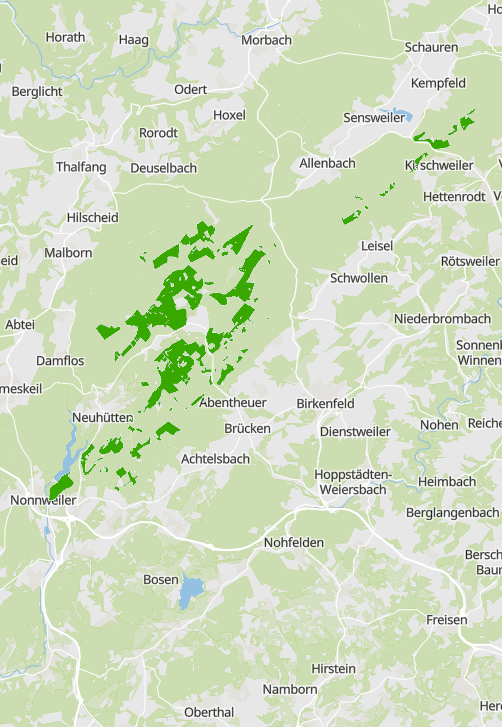
National park Hunsrück-Hochwald in 2022: Buffer zone 2 - Data source: Naturschutzverwaltung Rheinland-Pfalz. Adaptation: SIG-GR / GIS-GR 2022
-
National park Hunsrück-Hochwald in 2022: Nature zone 1a (wilderness areas) - Data source: Naturschutzverwaltung Rheinland-Pfalz. Adaptation: SIG-GR / GIS-GR 2022