 geocatalogue.geoportail.lu
Transportation
Type of resources
Available actions
Topics
Keywords
Contact for the resource
Provided by
Groups
Years
Representation types
Update frequencies
status
Scale
-

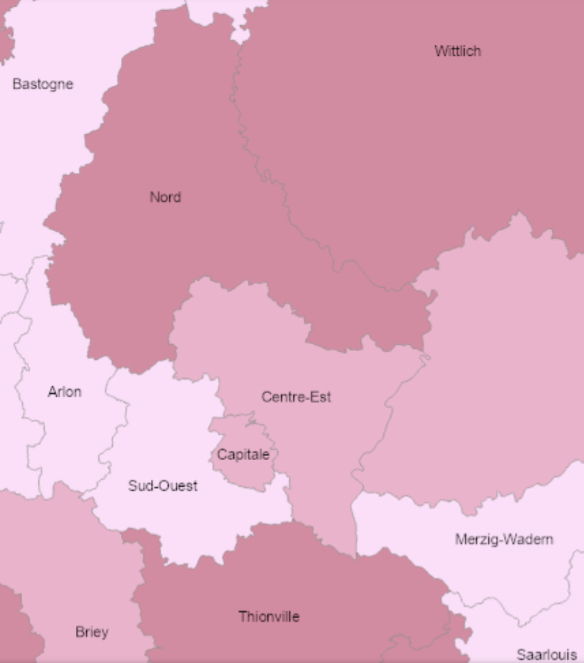
Share of road traffic accidents involving injury with seniors (aged 65+ years) 2018-2022 - Source: Sub-Working Group on Road Safety of the Summit of the Greater Region 2023 - Base map: © ACT Luxembourg 2017, IGN France 2017, GeoBasis-DE / BKG 2017, NGI-Belgium 2017
-
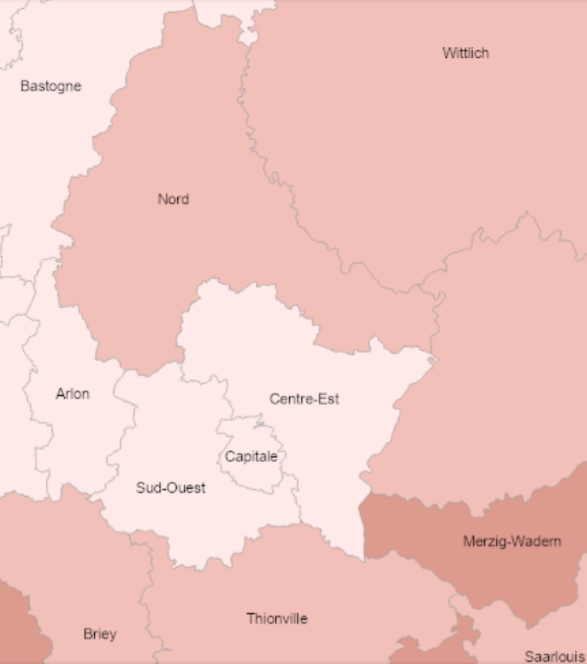
Share of road traffic accidents involving injury with young car drivers (aged 18-24 years) 2018-2022 - Source: Sub-Working Group on Road Safety of the Summit of the Greater Region 2023 - Base map: © ACT Luxembourg 2017, IGN France 2017, GeoBasis-DE / BKG 2017, NGI-Belgium 2017
-
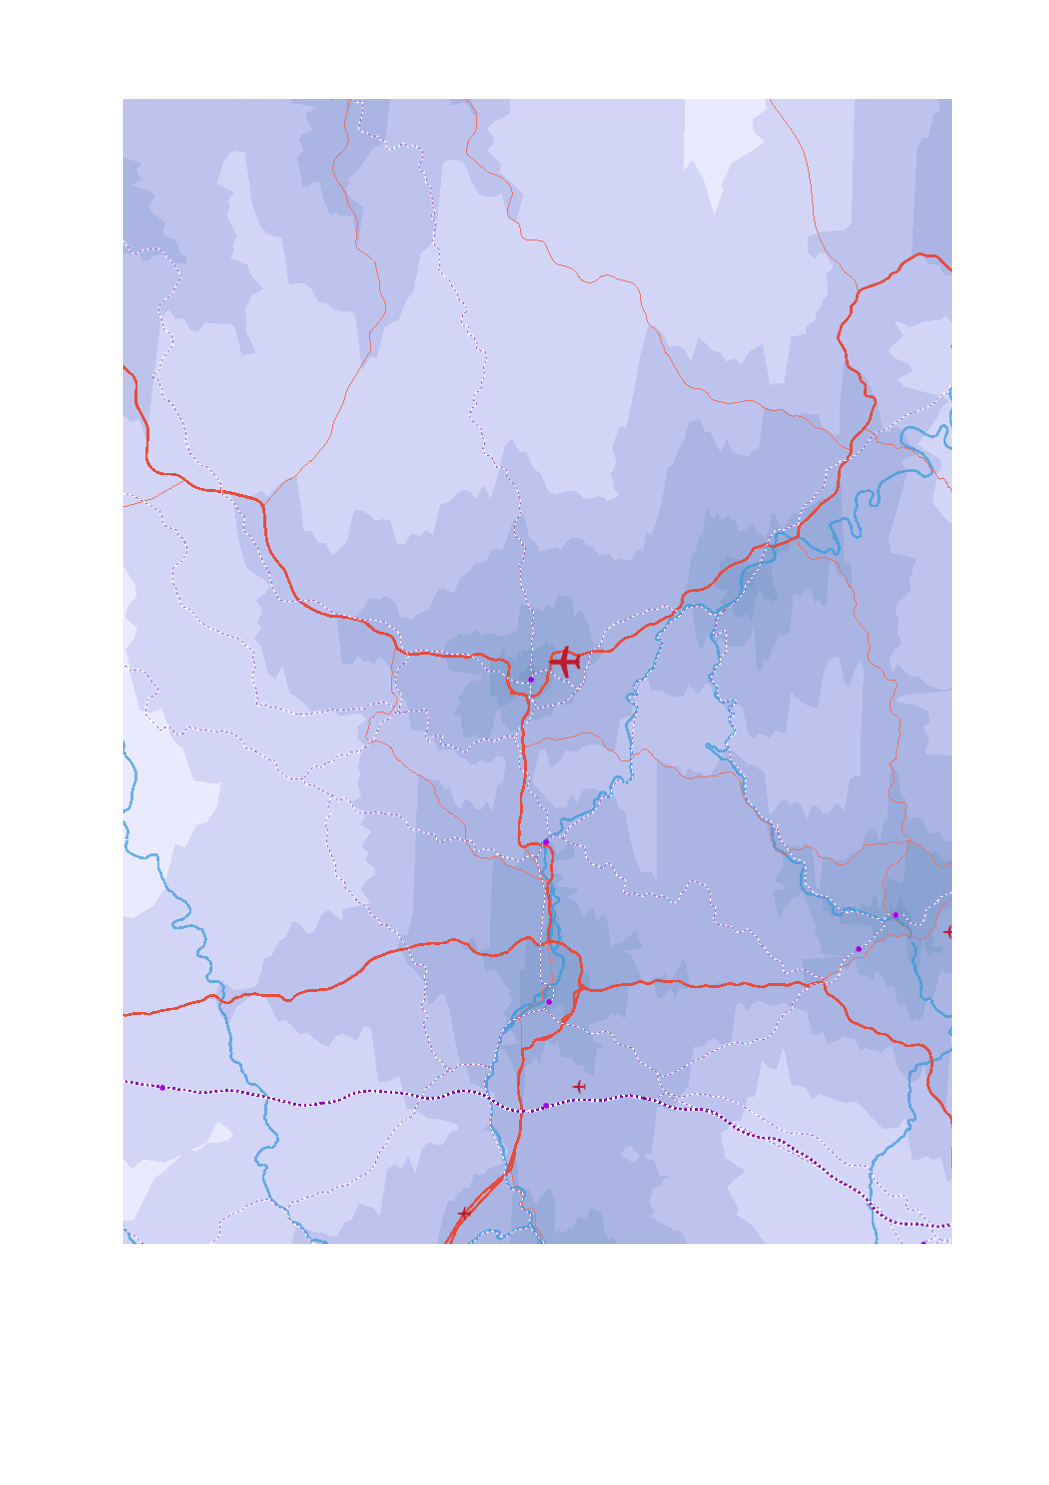
- Airport passengers 2017 - Trimodal hubs rail-road-water - Ports TEN-T - Airport passengers 2017 - High-speed railway lines - Railway lines TEN-T - Main roads (core network TEN-T) - Secondary roads (comprehensive network TEN-T) - Navigable waterways - Maritime links - Driving times to major centres at peak times in minutes (isochrones) - Sources: GISCO 2017; SIG-GR / GIS-GR 2017; European Environment Agency 2012; OSM 2017; European Commission 2017; EUROSTAT 2018. Harmonization: CREAT-UCL 2018.
-
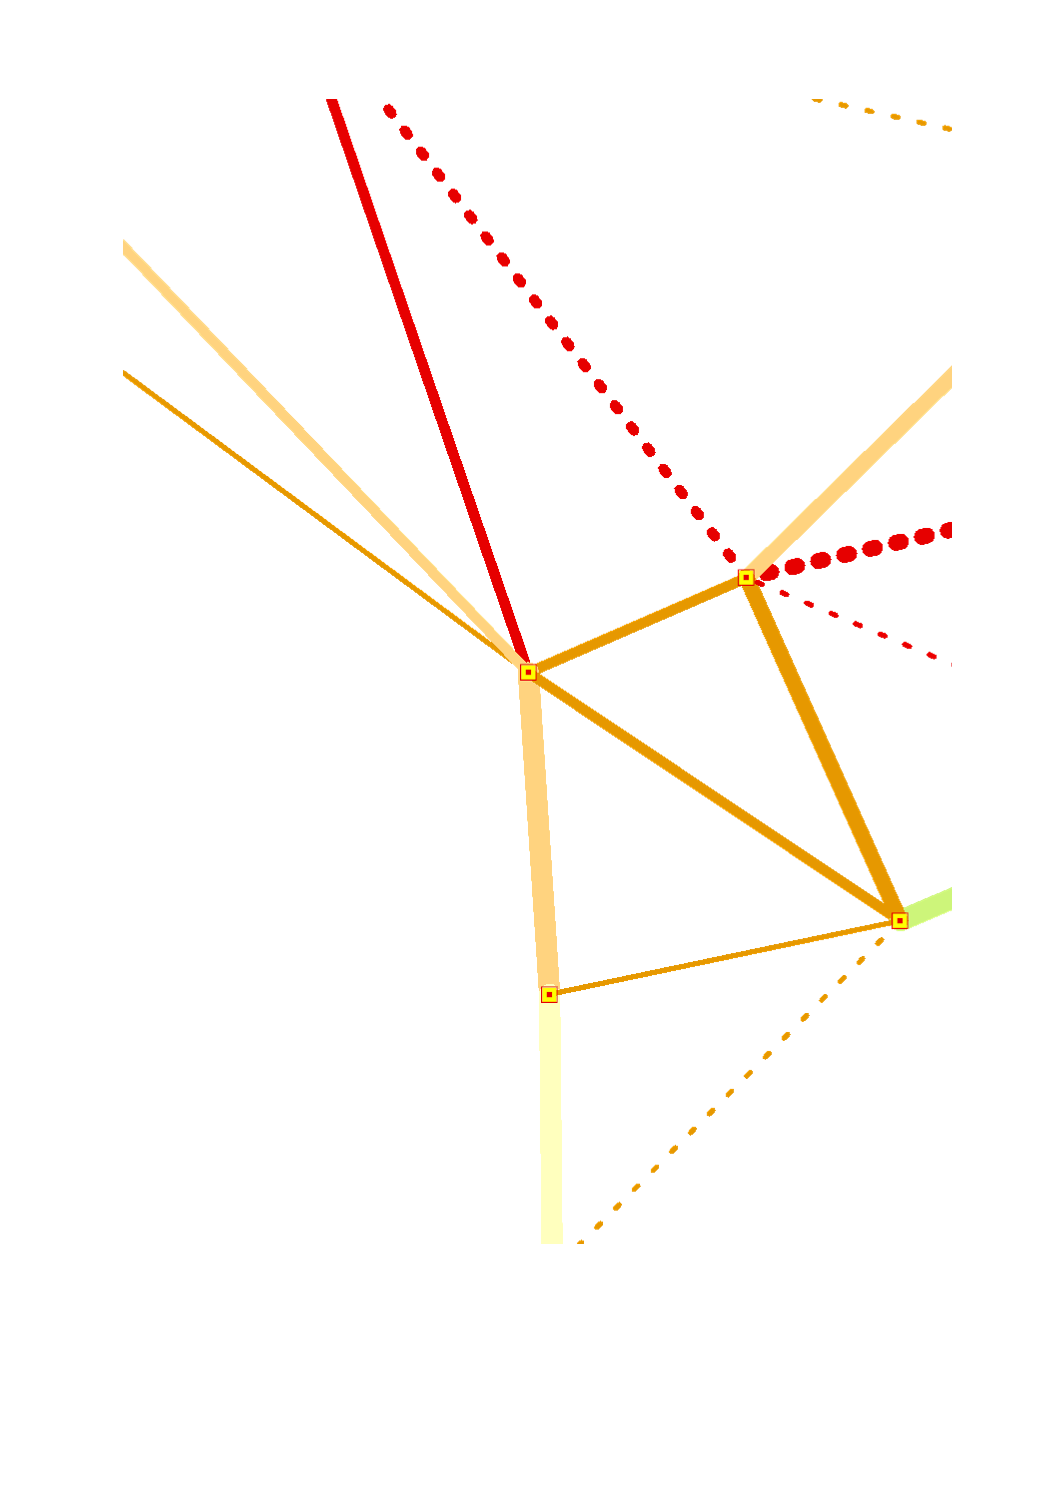
Quality of the intraregional rail connections (2017) based on the linear distance speed of the fastest connection between the major centres of the Greater Region - Sources: FAU, Deutsche Bahn 2017
-
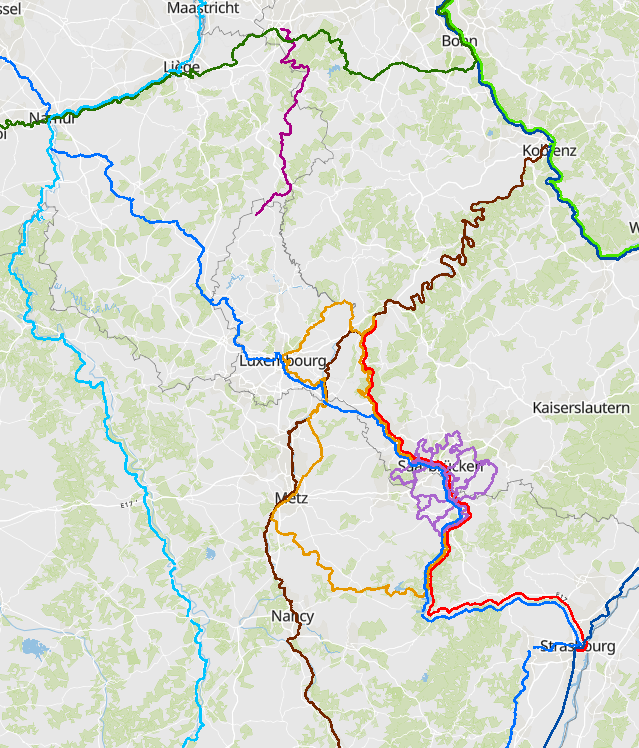
European and cross-border cycle paths 2021 - Sources: EuroVelo, biroto-Redaktion (biroto.eu), Luxembourg for Tourism 2021, OpenStreetMap and Contributors, Saarschleifenland Tourismus GmbH, Service pubic de Wallonie - DGO1, Stadtverband Saarbrücken, Tourismus Zentrale Saarland GmbH. Harmonization: SIG-GR / GIS-GR 2021
-
Share of road traffic accidents involving injury with children (aged 0-14 years) 2018-2022 - Source: Sub-Working Group on Road Safety of the Summit of the Greater Region 2023 - Base map: © ACT Luxembourg 2017, IGN France 2017, GeoBasis-DE / BKG 2017, NGI-Belgium 2017
-
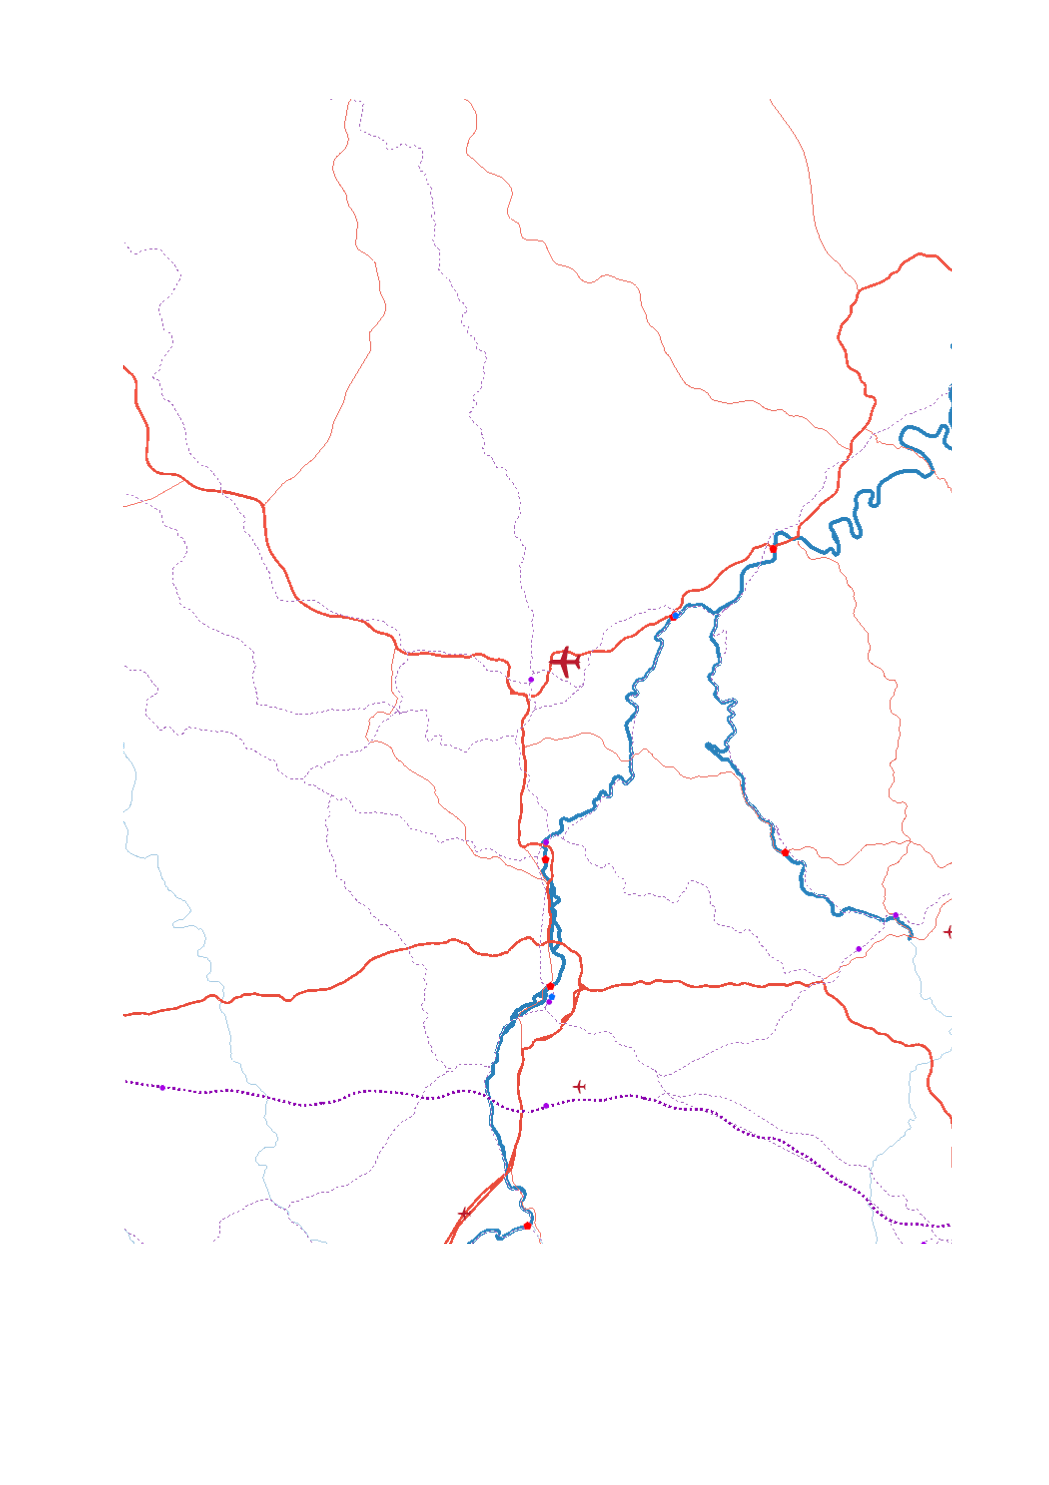
- Airport passengers 2017 - Trimodal hubs rail-road-water - Ports TEN-T Airport passengers 2017 - High-speed railway lines - Railway lines TEN-T - Main roads (core network TEN-T - Secondary roads (comprehensive network TEN-T) - Navigable waterways - Maritime links - Sources: GISCO 2017; SIG-GR / GIS-GR 2017; European Environment Agency - 2012; OSM-2017; European Commission 2017; EUROSTAT 2018. Harmonization: CREAT-UCL 2018
-
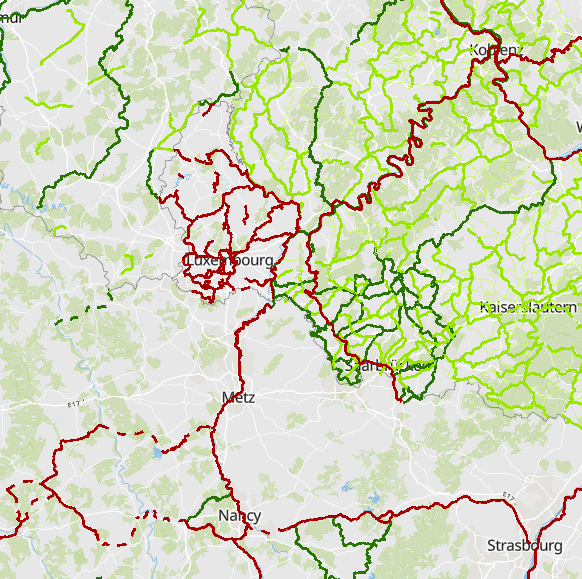
National and regional cycle paths 2021 - Sources: OpenStreetMap and Contributors, biroto-Redaktion (biroto.eu), Landesbetrieb Mobilität Rheinland-Pfalz, Landesbetrieb für Strassenbau (LfS), LVGL Saarland, Velo & Territoires, Veremes, Administration des Ponts et Chaussées - Divsion de la mobilité durable (LU), Service public de Wallonie (SPW - DGO1). Harmonization: SIG-GR / GIS-GR 2021
-
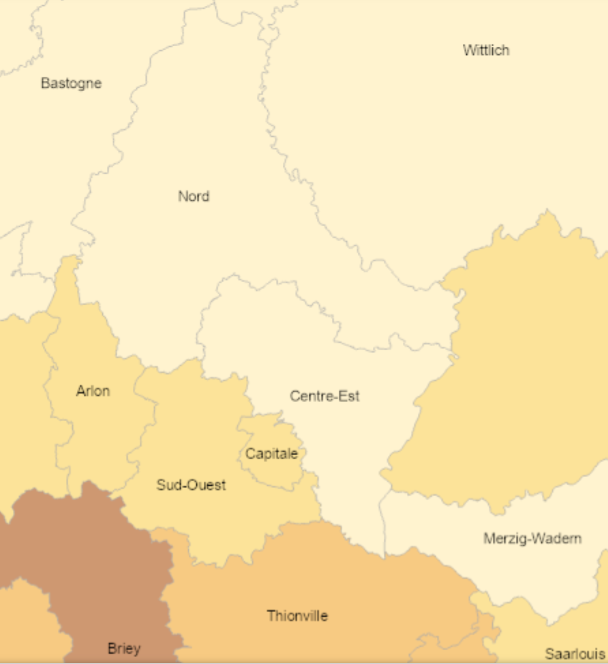
Share of road traffic accidents involving injury with motorized two-wheel vehicles (2018-2022) - Source: Sub-Working Group on Road Safety of the Summit of the Greater Region 2023 - Base map: © ACT Luxembourg 2017, IGN France 2017, GeoBasis-DE / BKG 2017, NGI-Belgium 2017
-
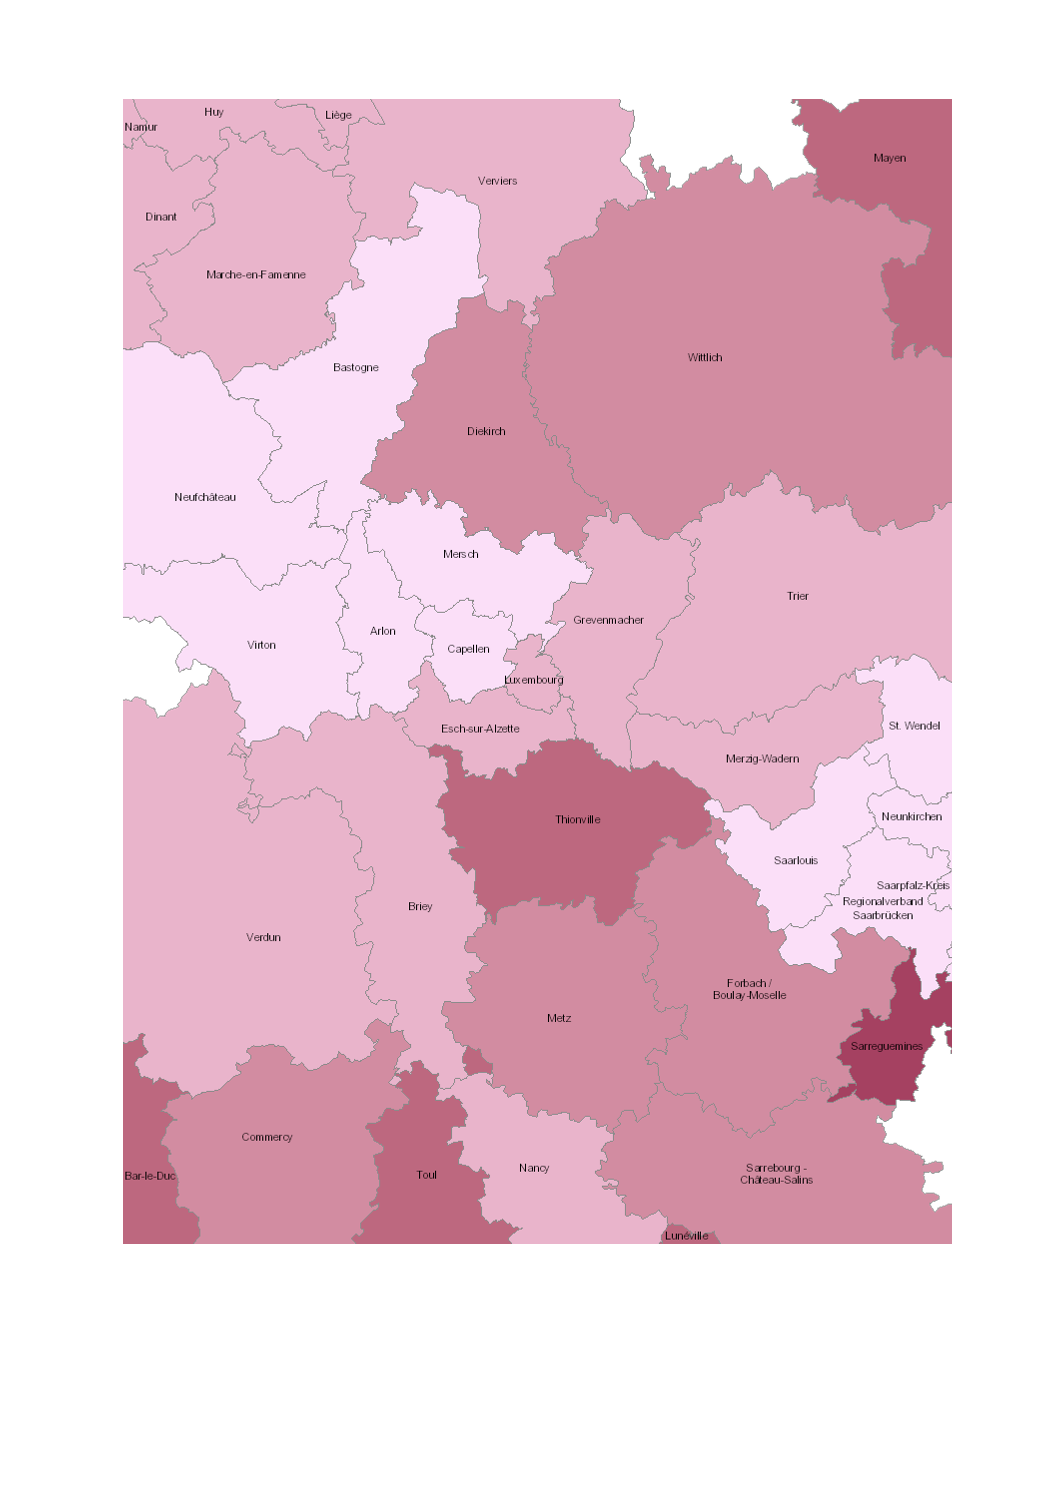
Share of road traffic accidents involving injury with motorized two-wheel vehicles (2015-2019) - Source: Sub-Working Group on Road Safety of the Summit of the Greater Region 2020 - Base map: © ACT Luxembourg 2017, IGN France 2017, GeoBasis-DE / BKG 2017, NGI-Belgium 2017