 geocatalogue.geoportail.lu
Administration du Cadastre et de la Topographie
Type of resources
Available actions
Topics
Keywords
Contact for the resource
Provided by
Groups
Years
Formats
Representation types
Update frequencies
status
Service types
Scale
-
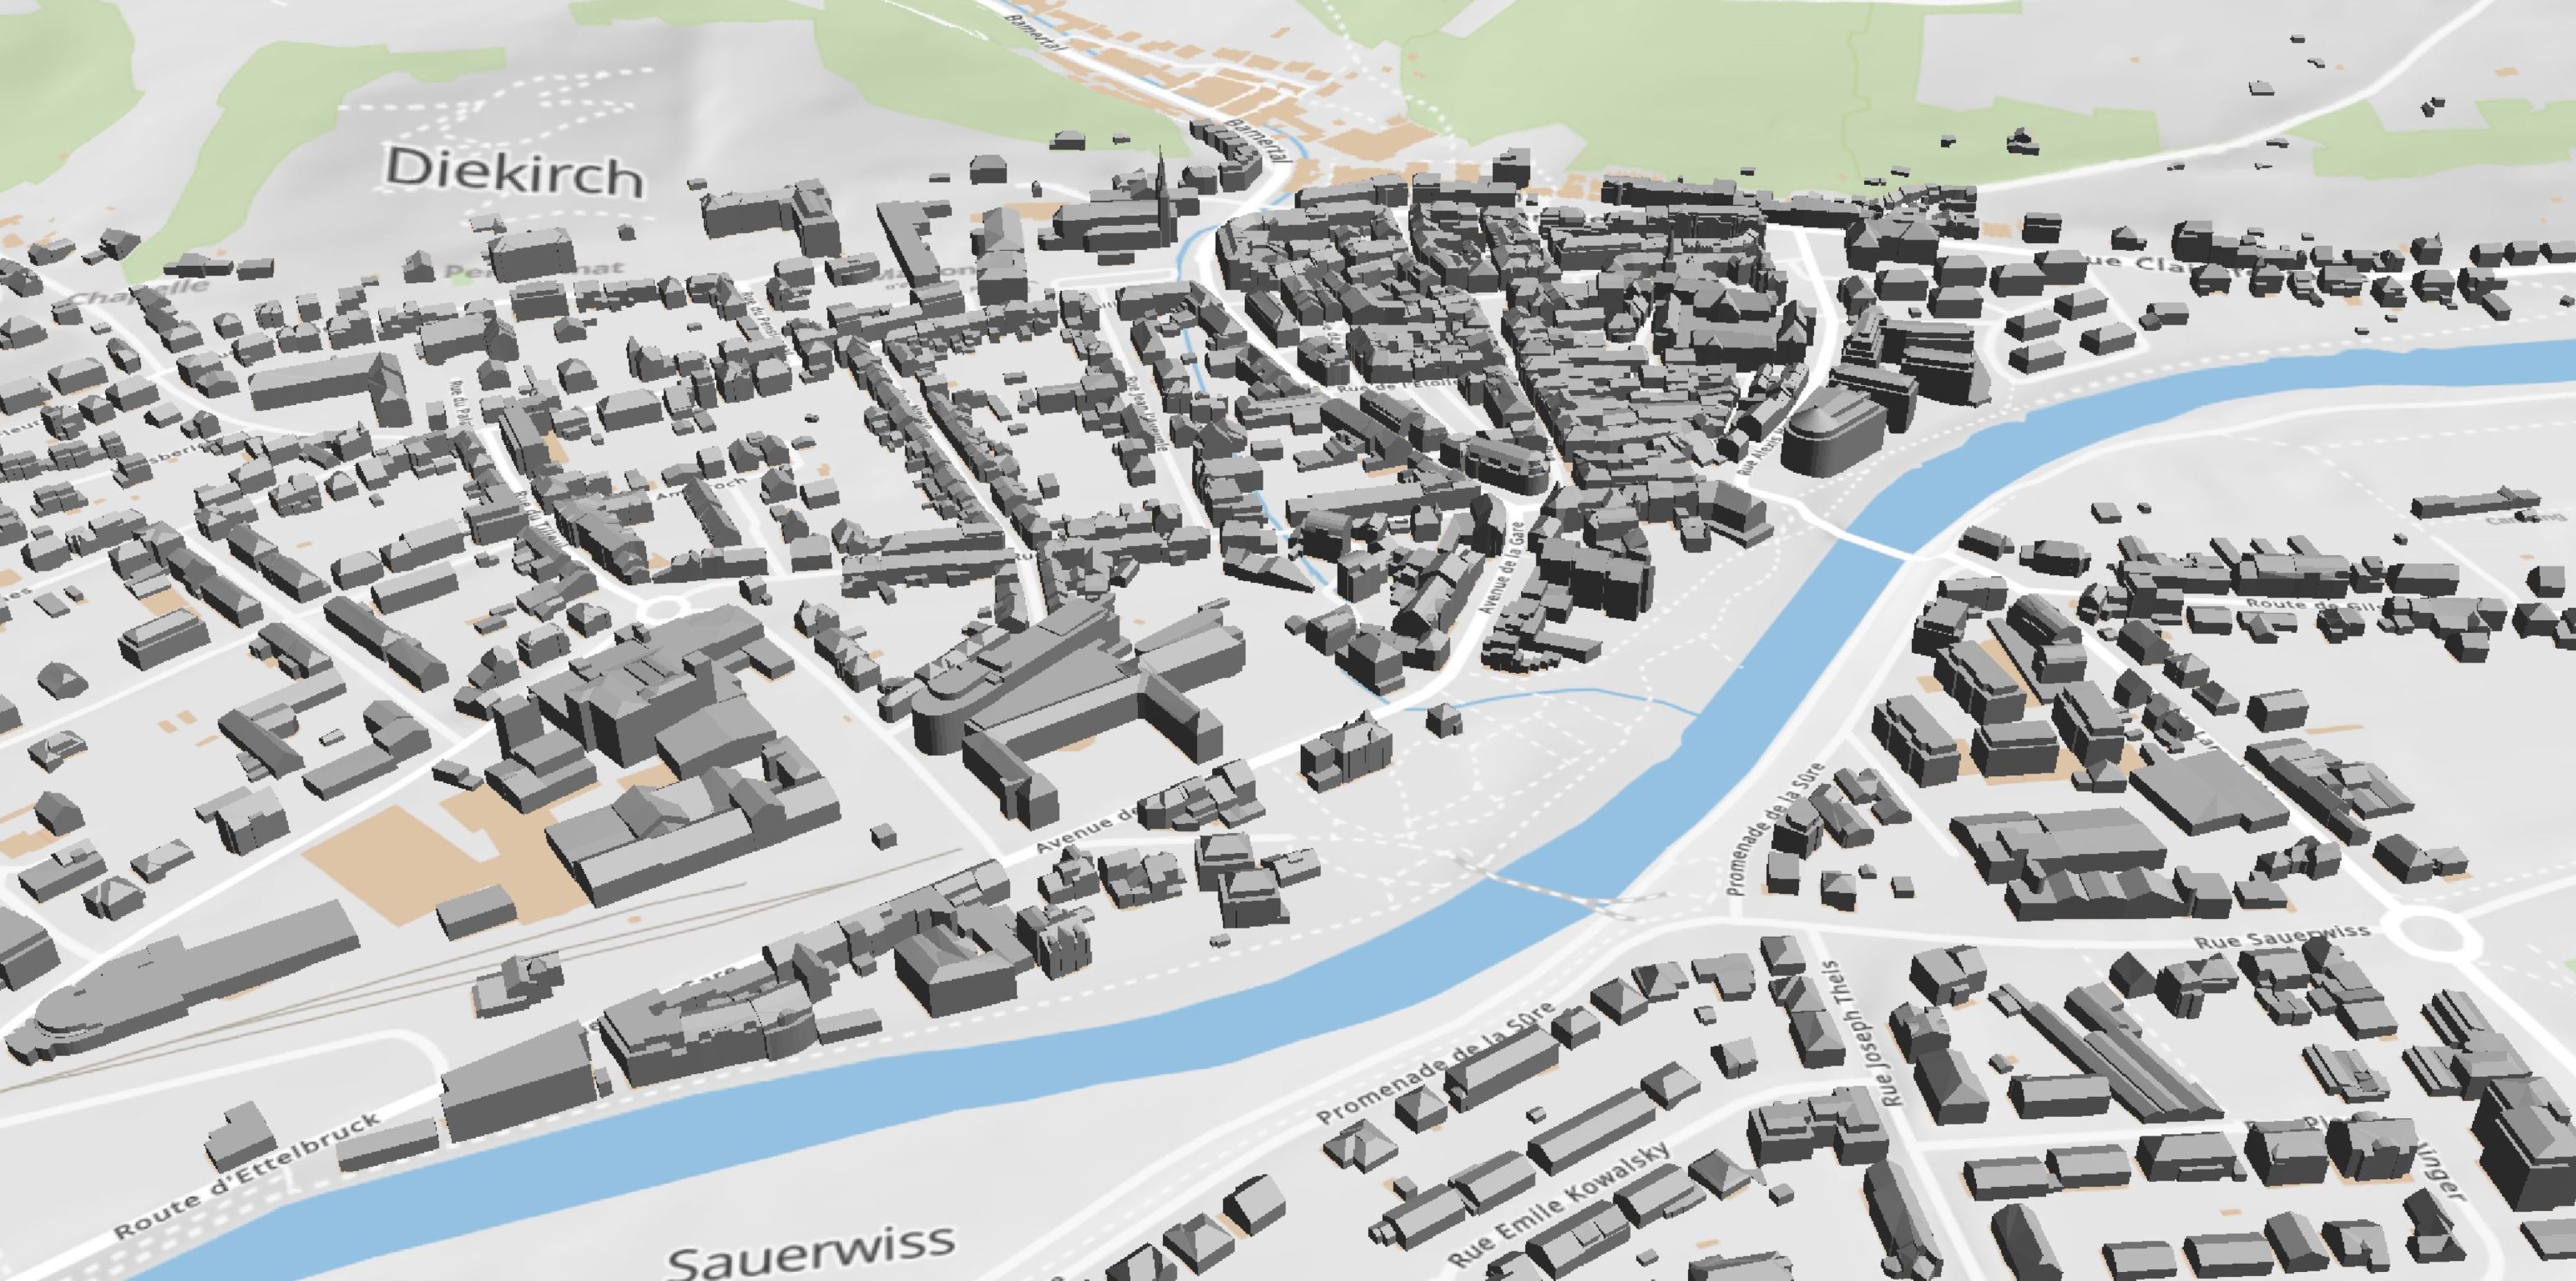
3D buildings with LOD 2.3 classification resulting from a proof of concept of 2017. The buildings are modelled based on a photogrammetric evaluation of aerial images from 2017 and are only available on a total area of 3 km2 in Diekirch and Bastendorf.
-
This layer contains the parcels and the status of the compensation projects.
-
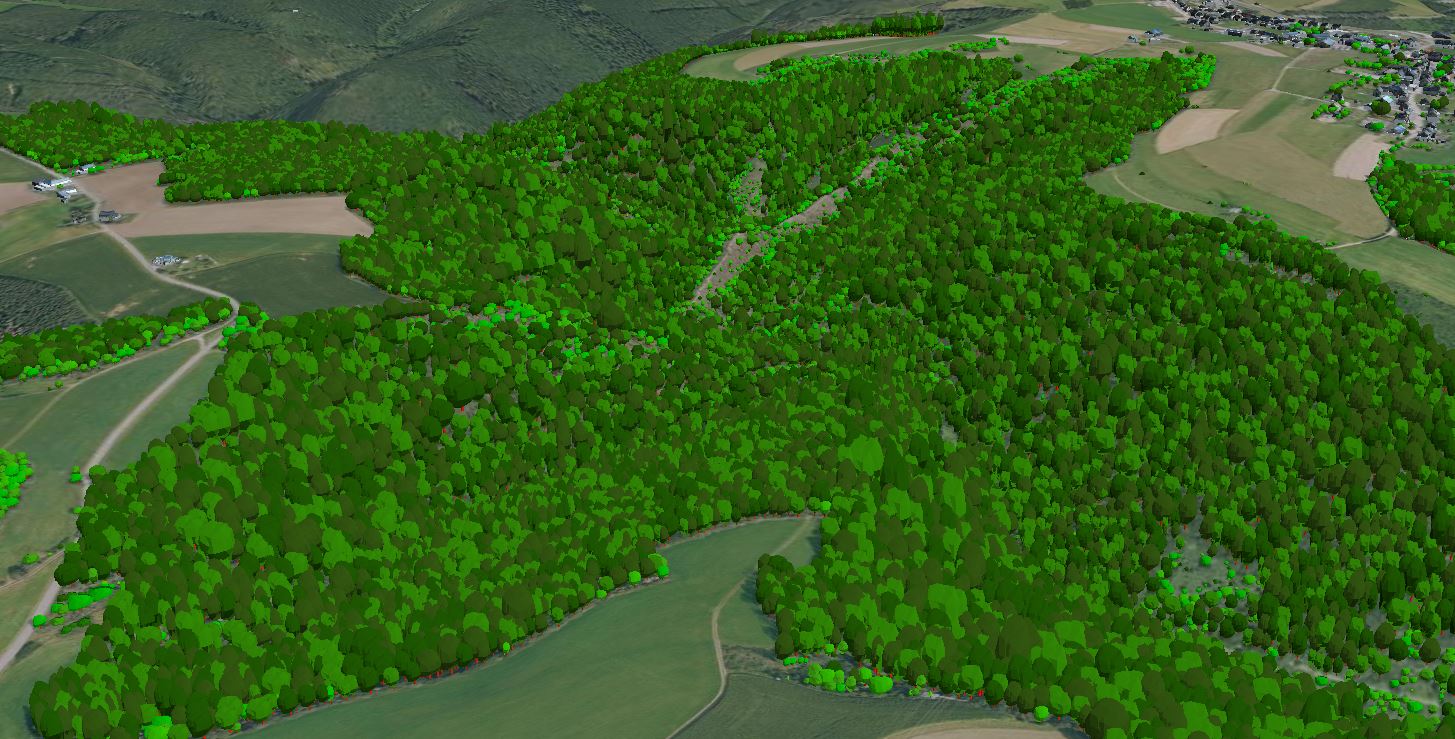
3D models of trees on the national territory of the Grand Duchy of Luxembourg, derived from the point cloud of the LiDAR survey in February 2019. The models do not correspond to the actual shape or type of the trees, but consist of a generalised model that has been scaled according to the tree parameters extracted from the point cloud.
-
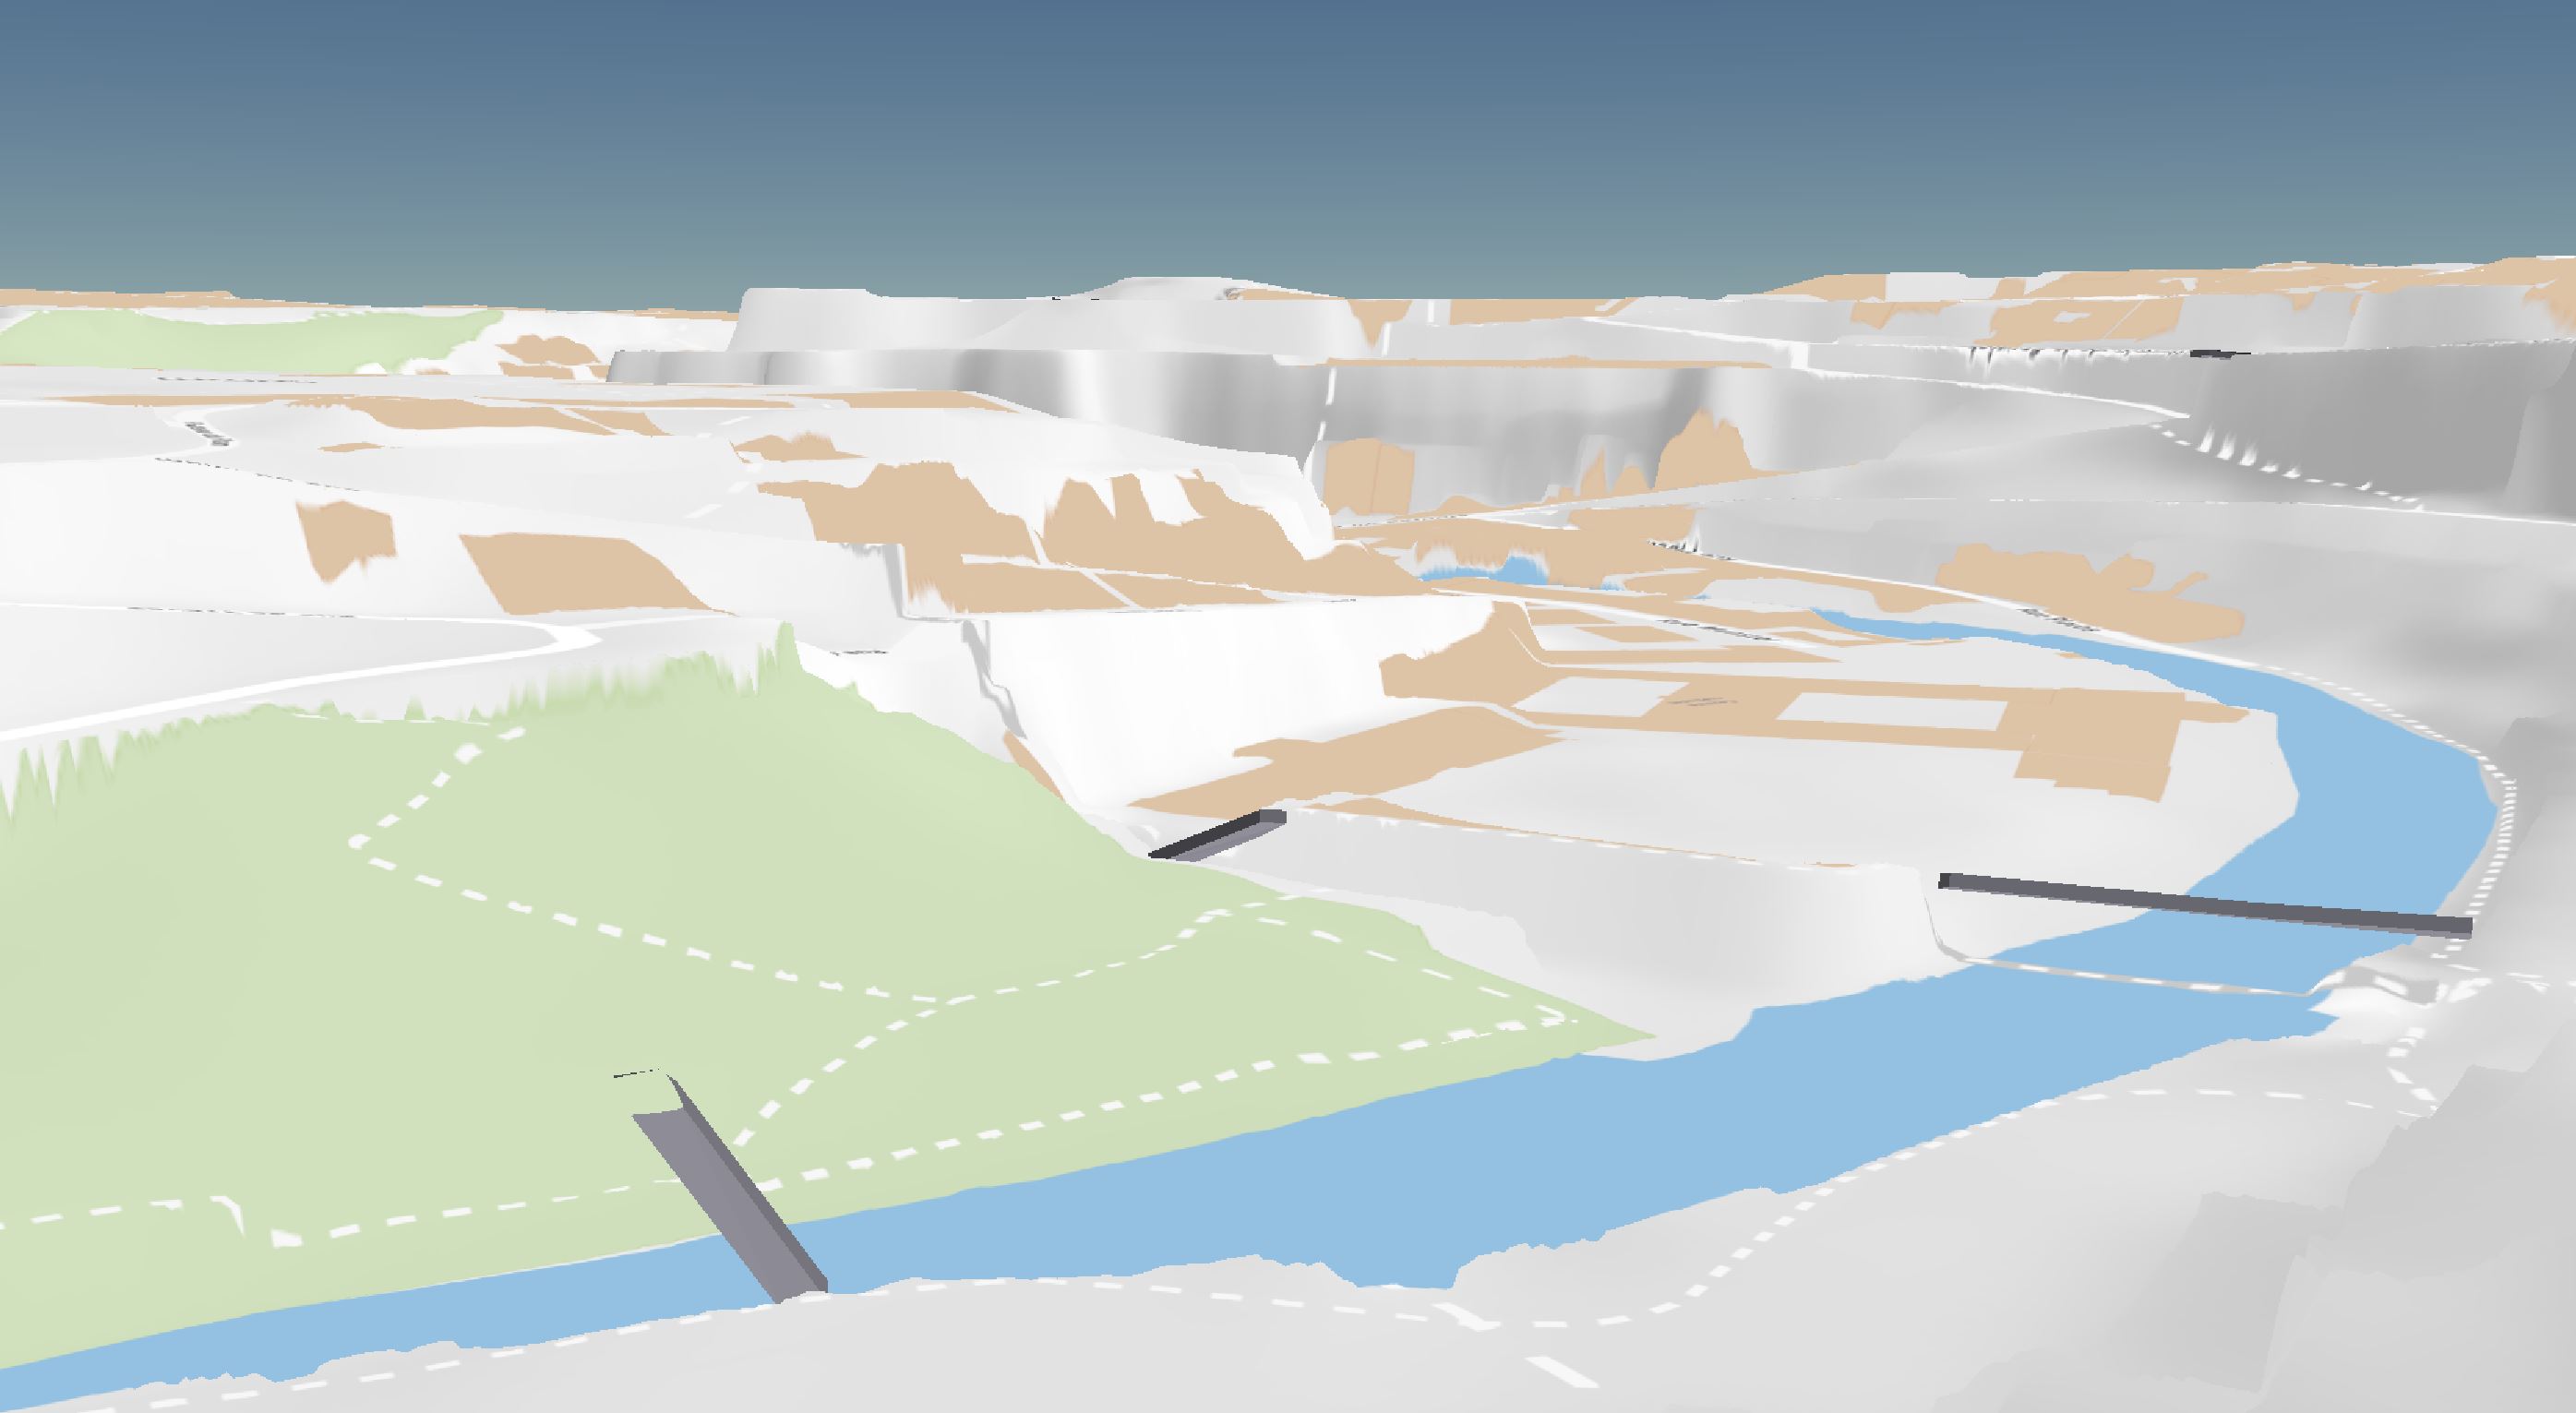
3D models with LOD 1 classification of the bridges on the national territory of the Grand Duchy of Luxembourg in 2019. The 3D models were automatically extracted from the point cloud of the LiDAR survey in February 2019.
-
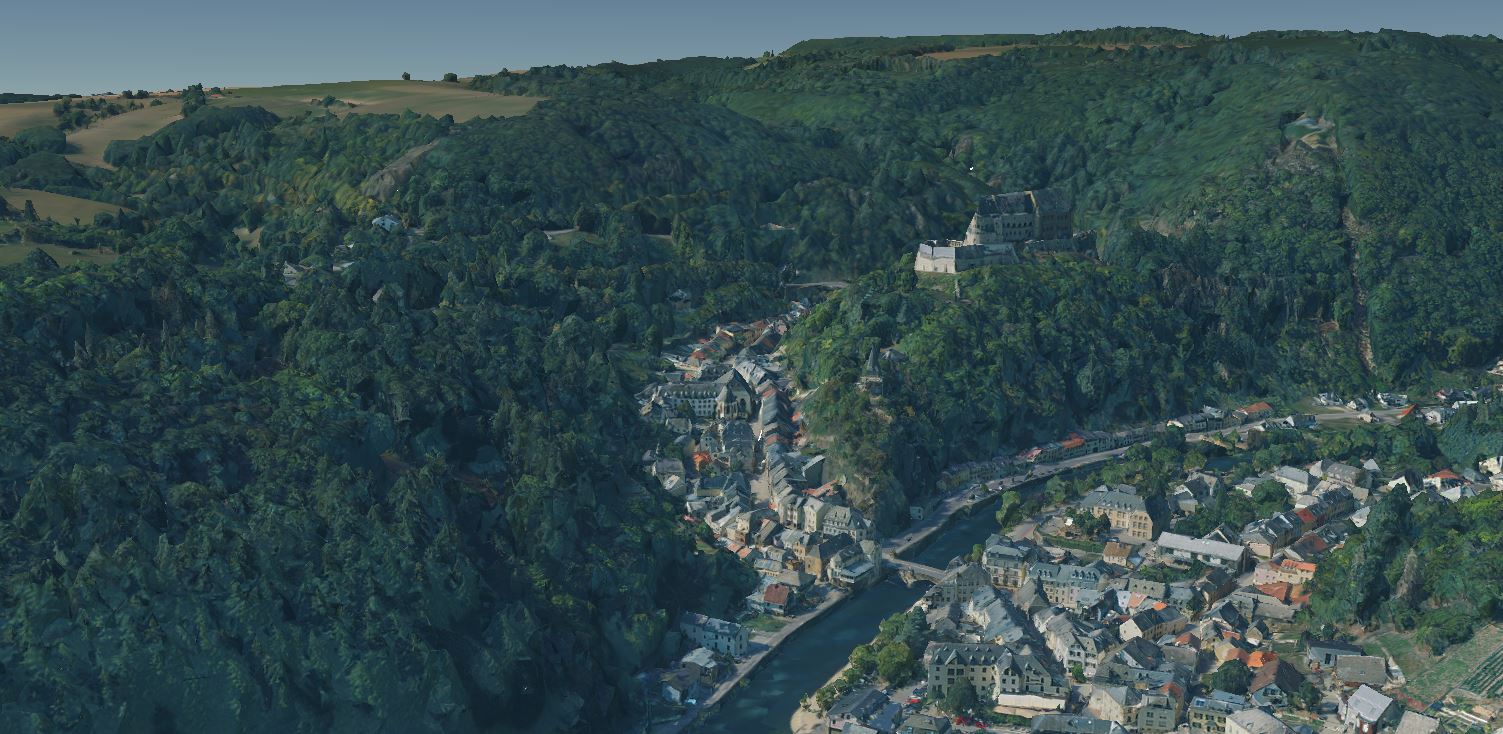
3D model of the Luxembourg terrain based on vertical and oblique aerial images from summer 2020.
-
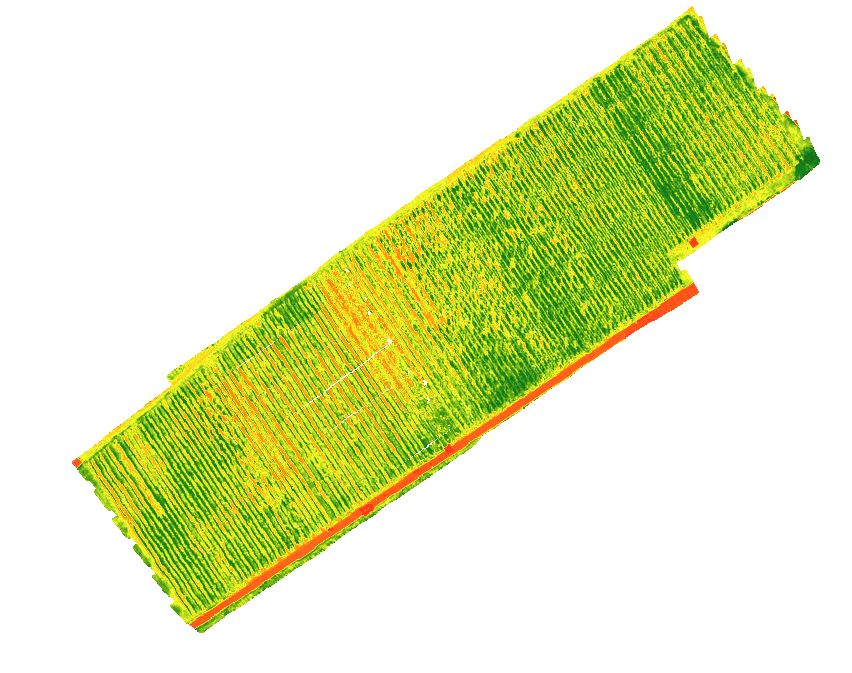
This layer shows the NDVI calculated using the spectral information from a hyperspectral camera (Headwall – Nano) recorded with a drone over the vineyard on September 3, 2019. NDVI (= Normalized Difference Vegetation Index) belongs to the vegetation indices, which can map the vitality of plants by using spectral information in the red and near-infrared. It has a defined value range and can be easily interpreted as healthy vegetation has values from 0.6 to 1 maximum.
-
This layer shows the NDVI calculated using the spectral information from a hyperspectral camera (Headwall – Nano) recorded with a drone over the vineyard on September 8, 2020. NDVI (= Normalized Difference Vegetation Index) belongs to the vegetation indices, which can map the vitality of plants by using spectral information in the red and near-infrared. It has a defined value range and can be easily interpreted as healthy vegetation has values from 0.6 to 1 maximum.
-

This layer shows the NDVI calculated using the spectral information from a hyperspectral camera (Headwall – Nano) recorded with a drone over the vineyard on July 30, 2020. NDVI (= Normalized Difference Vegetation Index) belongs to the vegetation indices, which can map the vitality of plants by using spectral information in the red and near-infrared. It has a defined value range and can be easily interpreted as healthy vegetation has values from 0.6 to 1 maximum.
-
This layer shows the NDVI calculated using the spectral information from a hyperspectral camera (Headwall – Nano) recorded with a drone over the vineyard on August 23, 2023. NDVI (= Normalized Difference Vegetation Index) belongs to the vegetation indices, which can map the vitality of plants by using spectral information in the red and near-infrared. It has a defined value range and can be easily interpreted as healthy vegetation has values from 0.6 to 1 maximum.
-
This layer shows the NDVI calculated using the spectral information from a hyperspectral camera (Headwall – Nano) recorded with a drone over the vineyard on August 29, 2022. NDVI (= Normalized Difference Vegetation Index) belongs to the vegetation indices, which can map the vitality of plants by using spectral information in the red and near-infrared. It has a defined value range and can be easily interpreted as healthy vegetation has values from 0.6 to 1 maximum.