 geocatalogue.geoportail.lu
Administration de l'Environnement - Unité Surveillance et Évaluation de l'Environnement
Type of resources
Available actions
Keywords
Contact for the resource
Provided by
Groups
Formats
Representation types
Update frequencies
status
Scale
-

Biomonitoring is conducted primarily in urban areas near electric arc steel mills. These facilities represent potential sources of emissions of organic and metal compounds that are then transported by air to urbanized areas. Metal compounds emitted by steel mills are fixed by dust particles. Solid, liquid or gaseous organic compounds may also adsorb or be absorbed by these particles. The organic pollutants studied in a biomonitoring network are dioxins/furans (PCDD/PCDF), polycyclic aromatic hydrocarbons (PAHs) and polychlorinated biphenyls (PCBs). As an accessory, to complete the observations and to establish correlations with the other pollutants, the accumulation of heavy metals cadmium, chromium, mercury, lead, vanadium and zinc is also analysed. https://environnement.public.lu/fr/loft/air/mesures/publications-periodiques.html
-
The passive sampling method allows the use of simple equipment to determine NO2 nitrogen dioxide and benzene concentrations at specific locations. Establishing a network with several measurement points is quick and requires little equipment. Passive samplers (cylindrical tubes of 3 to 7 cm long and 1 cm in diameter)are exposed to the open air for a fixed period, in about 3 meters high.By simple diffusion of the pollutant in the air, it is going to be trapped by the sampler. Usually the passive diffusion tubes are installed in narrow streets which are strongly influenced by traffic.
-
The Grobscreening is used for the identification of hotspots for the NO2-air pollution on major roads in the Grand Duchy of Luxembourg for the year 2016. Every road segment in the country that presents a circulation of more than 5000 vehicles a day and a relevant roadside construction is inspected. The annual mean of NO2 is then determined.
-

In 2019, the environmental administration organised a nationwide air quality measurement campaign in collaboration with 29 participating municipalities and myenergy. More specifically, it is a national measurement campaign of NO2 by passive tubes in the context of the national air quality program and the "Klimapakt Loftqualitéit". The campaign aims to raise awareness and inform municipalities and their inhabitants about the air quality in their respective municipalities, motivate municipalities to contribute to improving their air quality, and demonstrate the efforts undertaken by municipalities for future communications.
-

This layer harbors data, the locations as well as the drawn surfaces of the old landfills. These landfills are closed and the surfaces have been restructured.
-

The map shows the distribution of NOX emissions 2019 of the sector "Public electricity and heat production" in kt using the EMEP grid 0.1° x 0.1°. The disaggregation is carried out using E-PRTR database.
-
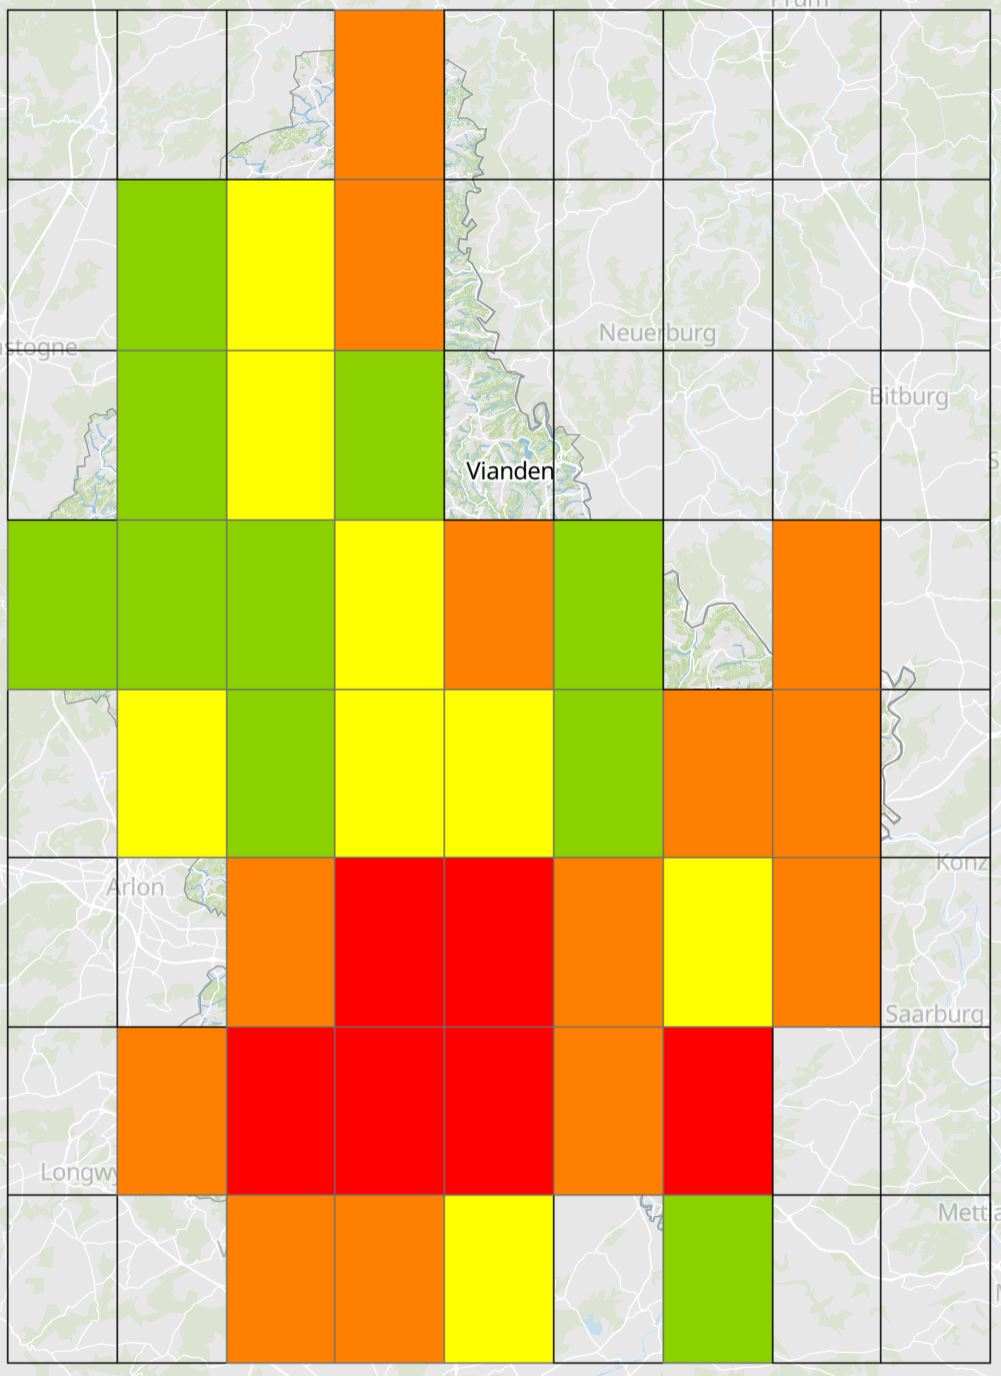
The map shows the distribution of PCB emissions 2019 of the sectors "SCMIC*: Iron and steel", "SCMIC*: Non-ferrous metals", "SCMIC*: Chemicals", "SCMIC*: Pulp, Paper and Print", "SCMIC*: Food processing, beverages and tobacco", "SCMIC*: Non-metallic minerals", "SCMIC*: Other", "Glass production", "Construction and demolition", "Iron and steel production", "Aluminium production", "Road paving with asphalt", "Food and beverage industry" and "Consumtion of POPs and heavy metals" in kg using the EMEP grid 0.1° x 0.1°. *SCMIC: Stationary combustion in manufacturing industries and construction. The disaggregation is carried out using the geometry of the road network and the annual mileage in Luxembourg and using the E-PRTR database.
-

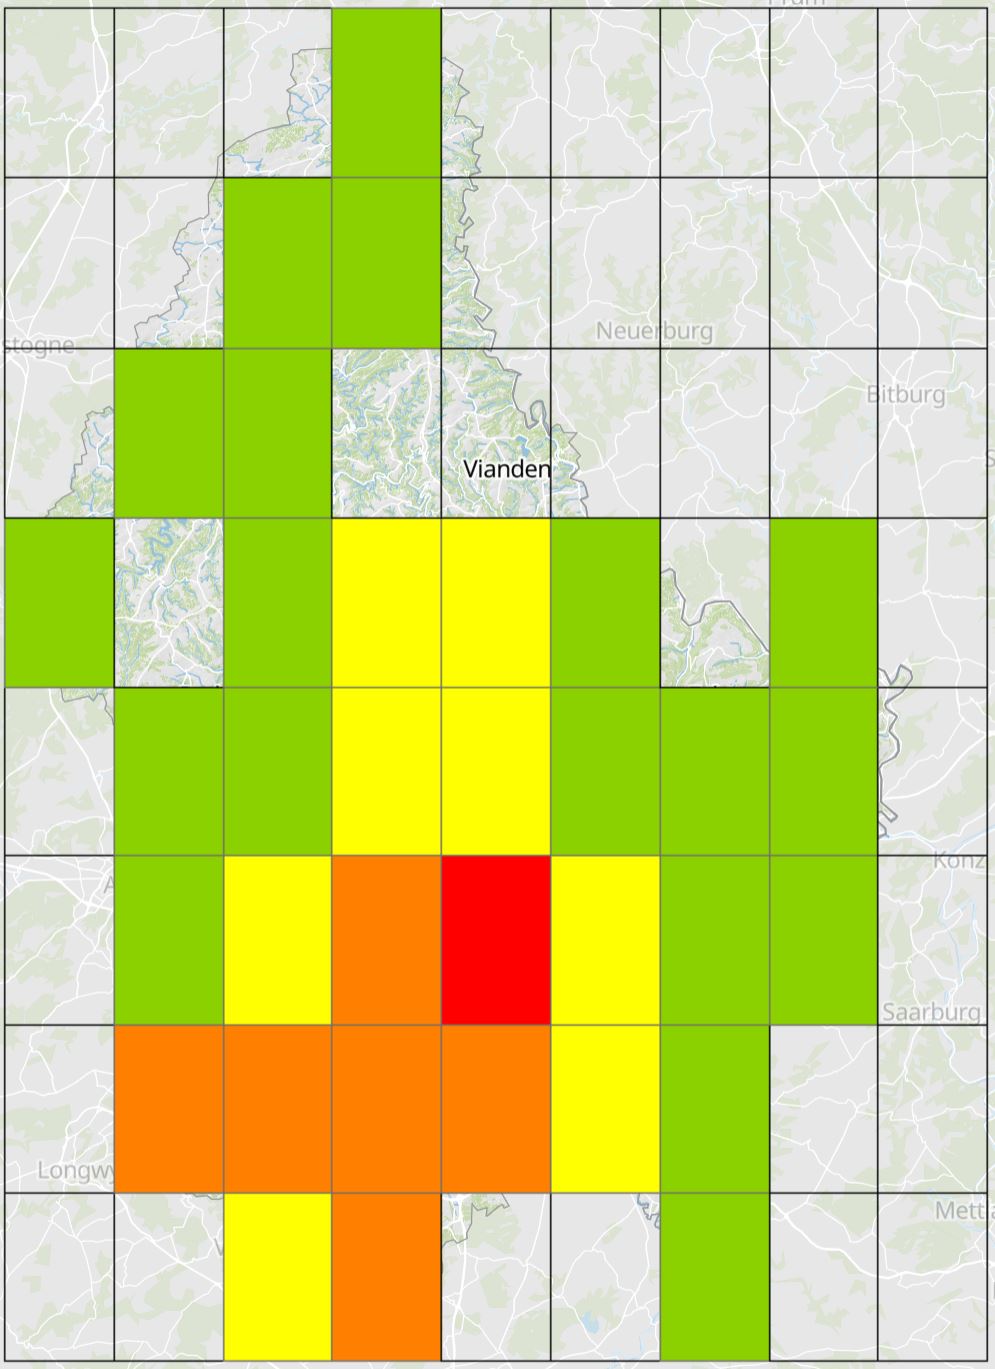
The map shows the distribution of CO emissions 2019 of the sectors "Commercial/institutional: Stationary", "Residential: Stationary" and "Agriculture/Forestry/Fishing: Stationary" in kt using the EMEP grid 0.1° x 0.1°. The disaggregation is carried out using the heating database and using an evaluation of the agricultural plants and wine estates.
-
The map shows the distribution of NMVOC emissions 2019 of the sectors "Fugitive emission from solid fuels: Coal mining and handling", "Distribution of oil products" and "Fugitive emissions from natural gas" in kt using the EMEP grid 0.1° x 0.1°. The disaggregation is carried out using the relevant NACE groups, using the population, using the location of the filling stations and using the heating database.
-

The map shows the distribution of NMVOC emissions 2019 of the sectors "Domestic solvent use including fungicides", "Coating applications", "Degreasing", " Dry cleaning", "Chemical products", "Printing", "Other solvent use" and "Other product use" in kt using the EMEP grid 0.1° x 0.1°. The disaggregation is carried out using the population and using the number of employees in companies emitting solvents.