 geocatalogue.geoportail.lu
Main>Land surface>Digital elevation model (BD-L-LiDAR)>LiDAR 2019
Type of resources
Available actions
Keywords
Contact for the resource
Provided by
Groups
Representation types
Update frequencies
status
Scale
-

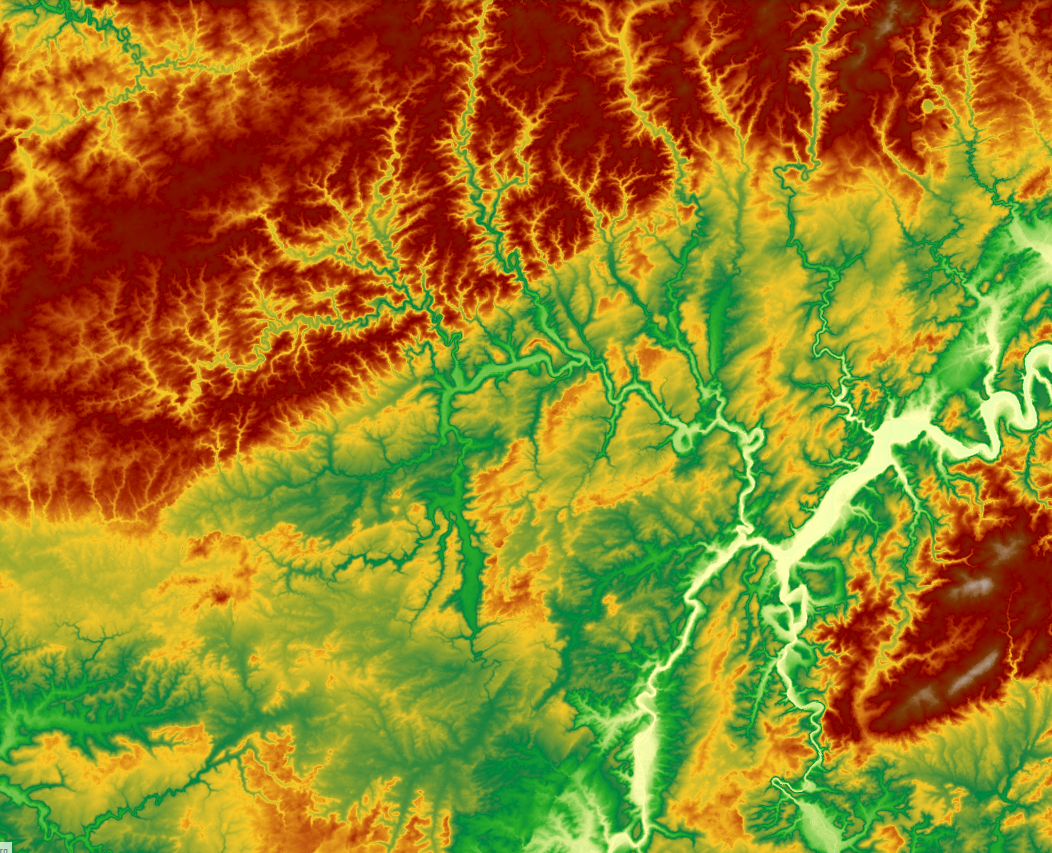
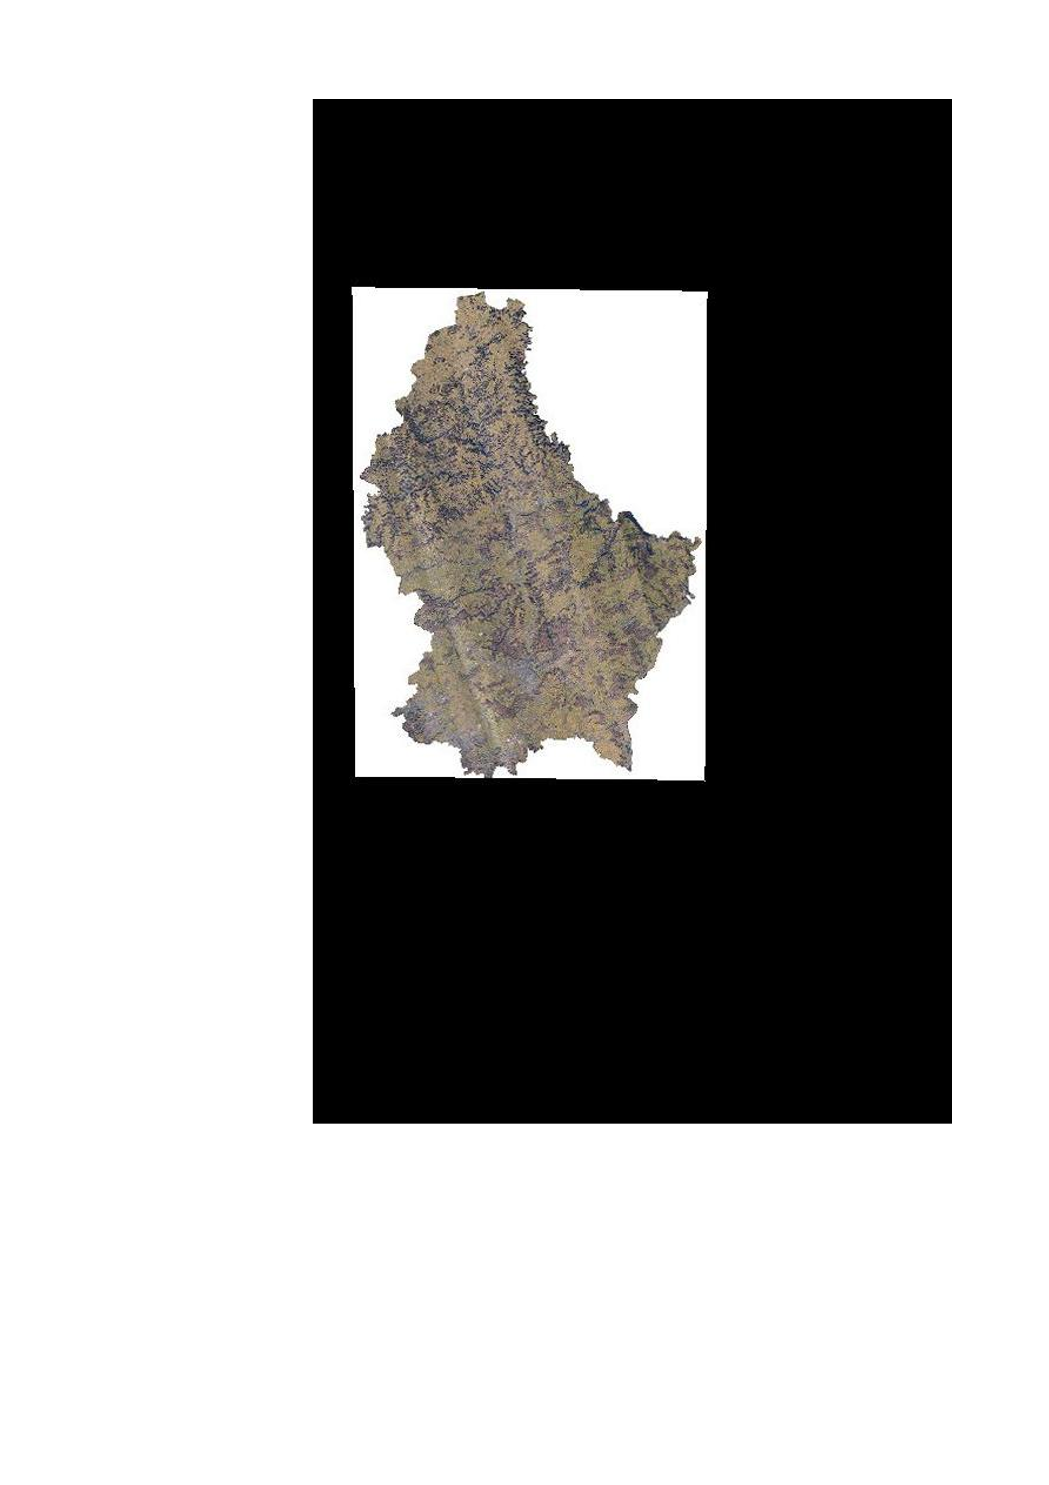
Hillshade based on the 2024 digital surface model and colorized with colors on the hue scale to represent height.
-
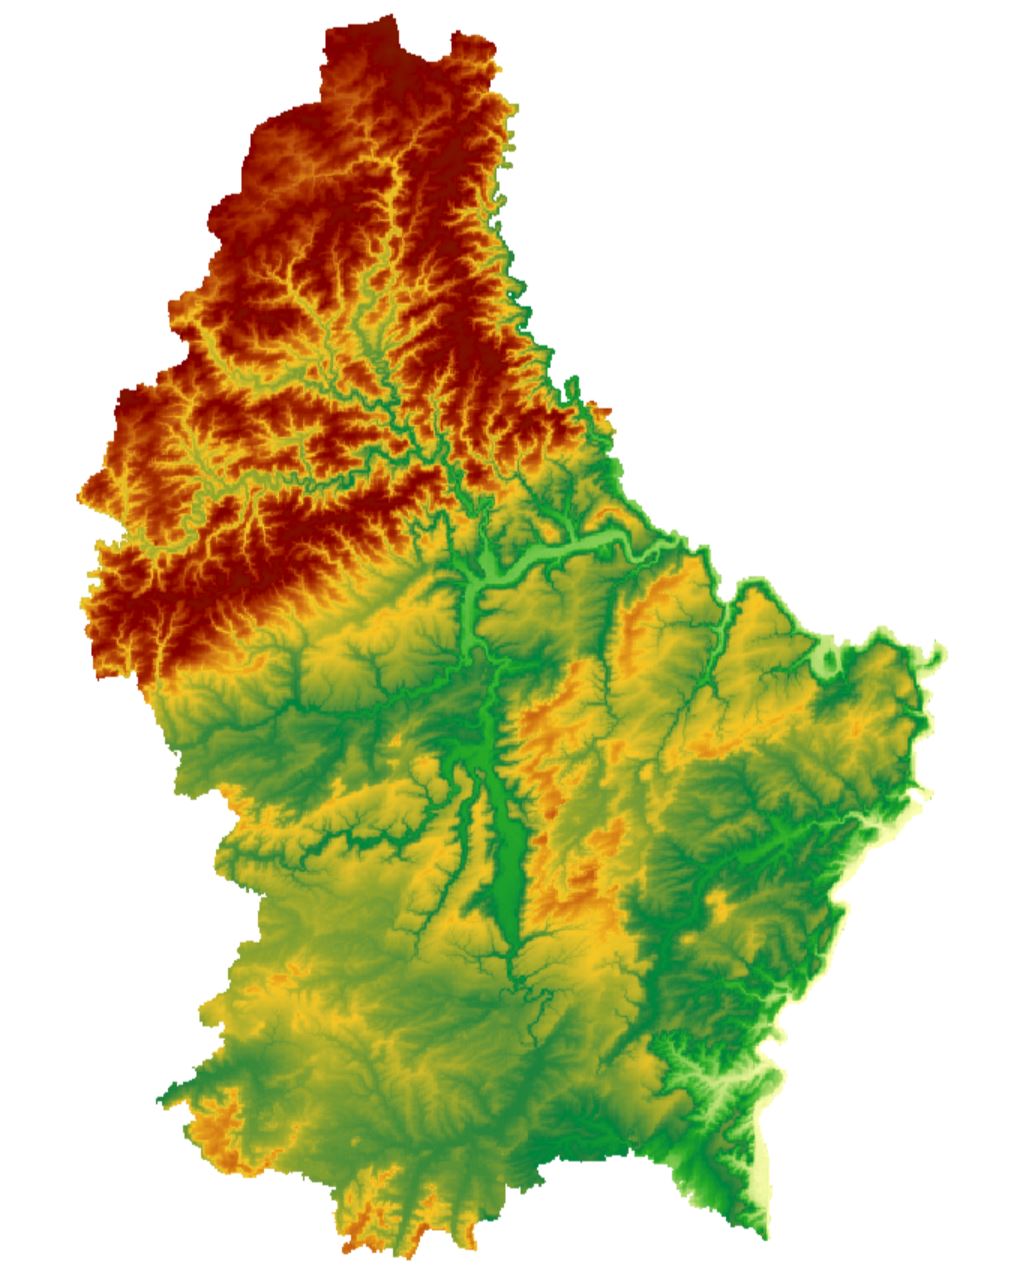
Digital elevation model with LUREF heights based on the 2024 Lidar acquisition with a ground resolution of 50cm.
-

This layer contains the subdivision into tiles of the LiDAR data from 2019. The data is issued from a three-dimensional survey based on LiDAR (Light Detection and Ranging) technology. From a technical point of view, the LiDAR system, or airborne LiDAR measures the distance between the ground and the aircraft using an infrared laser beam. The resulting data is processed to produce a three-dimensional coordinate file (point cloud) with a decimeter accuracy per pixel on the ground. For this prototype around the Nordstad region, the flyover was carried out in February 2019 with a density of 15 points per square meter and a horizontal accuracy of +/- 3 cm and vertical of +/- 6 cm. The density indicates the pulses sent from the system, the density of the points measured can be higher depending on the type of surface scanned (Single reflection/multiple reflection). Point cloud - Data structure The raw data is structured in the form of tiles with a spatial extent of 500 mx 500 m, they contain on average between 5 and 7 million measured points. To simplify the downloading of the data, the raw tiles have been grouped together in the form of compressed files (zip) comprising up to 9 raw tiles (representing a spatial extent of 1500 m × 1500 m). The assembly table with the zip files allows an overview of the grouped tiles. Point cloud - point classification The point cloud is classified into 9 different categories: [0] - Unclassified points [2] – Ground [3] - Low vegetation [4] - Average vegetation [5] - High vegetation [6] - Buildings [7] - Low Points (noise) [9] - Water [13] - Bridges, Footbridges, Viaducts [15] - Powerlines The number in [] indicates the Class ID.
-

Hillshade based on the 2024 digital surface model
-

In february 2019, the ACT has executed a LiDAR flight for the whole country. One of the results of this dataset is a high resolution digital surface model.
-
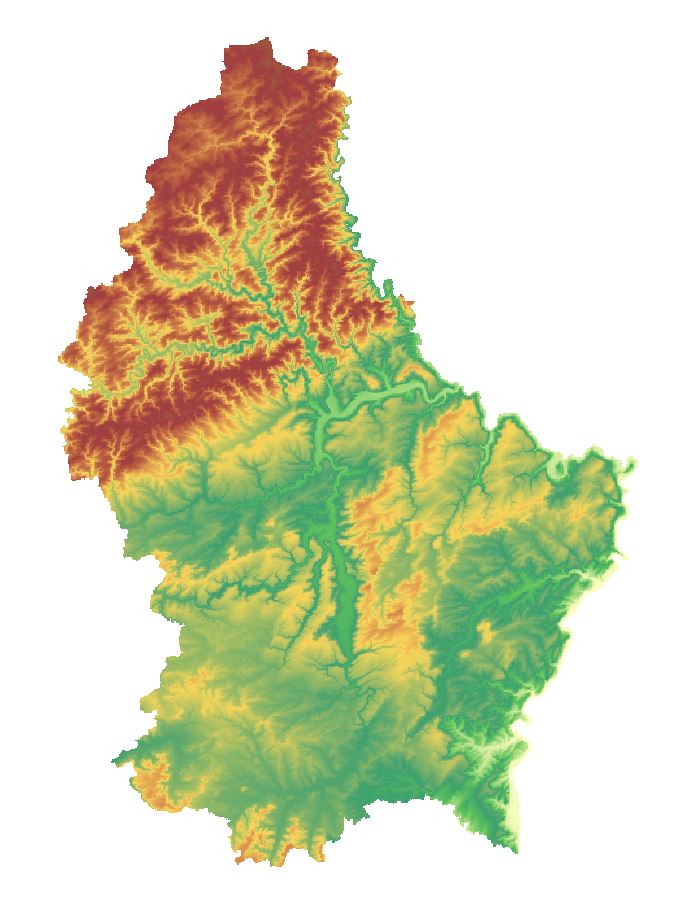
Digital elevation model with alternative coloring originating from the airborne LiDAR survey from February 2019 with a 50 cm resolution.
-
In February 2019, the ACT has executed an airborne LiDAR survey for the whole country. One of the resulting products is a digital elevation model with a 50 cm resolution, combined with a hillshade.
-
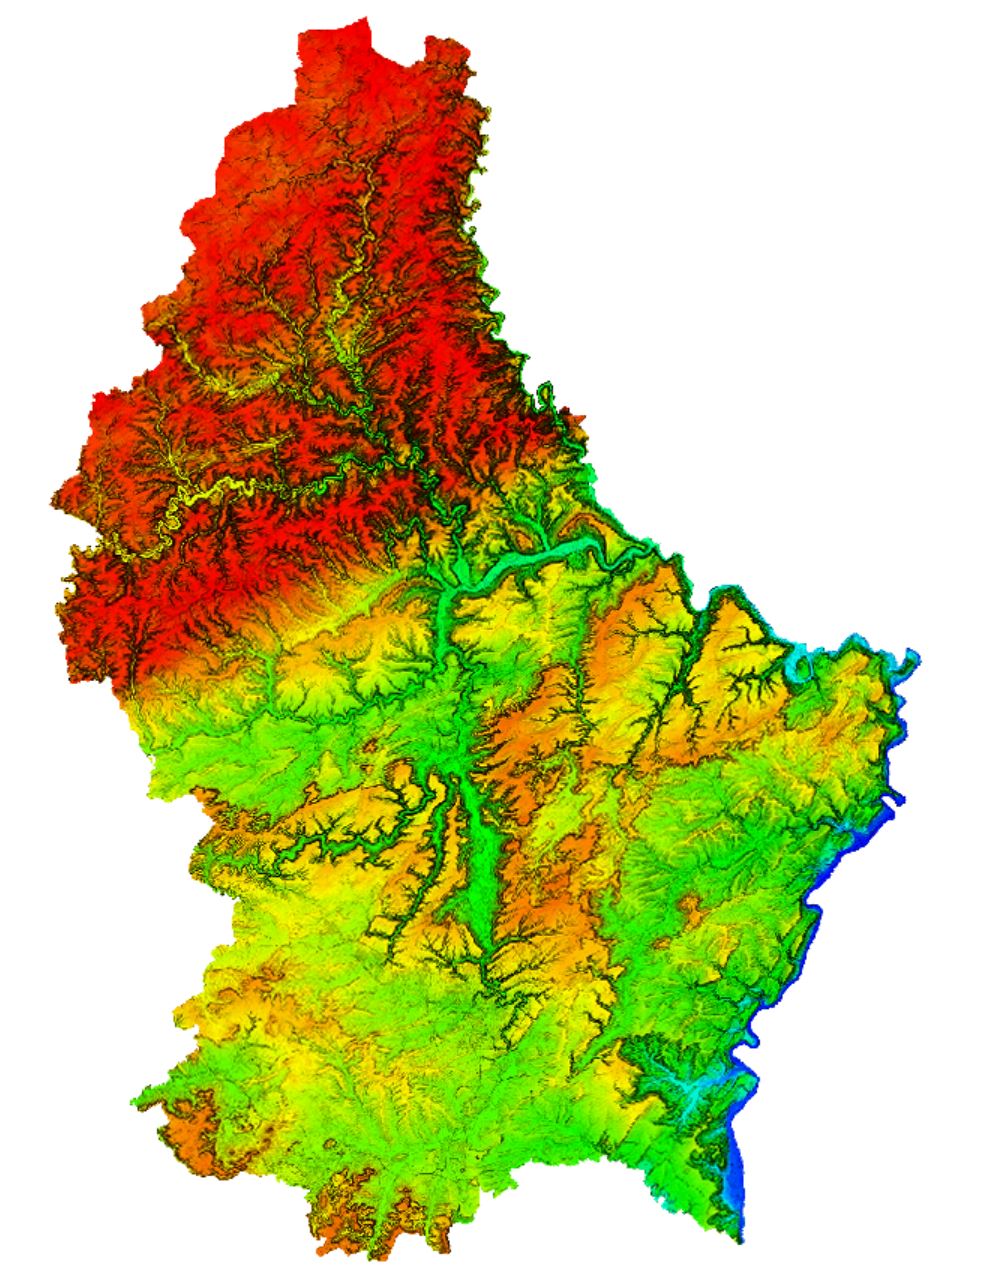
Digital elevation model from 2017 with alternative coloring with a 100 m resolution.
-
In february 2019, the ACT has executed a LIDAR flight for the whole country. Issued from the same flight, this aerial image (orthophoto) is primary for technical use.