 geocatalogue.geoportail.lu
Main>Environment, biology and geology>Viticulture
Type of resources
Available actions
Keywords
Contact for the resource
Provided by
Groups
Years
Representation types
Update frequencies
status
Scale
-
This layer shows the NDVI calculated using the spectral information from a hyperspectral camera (Headwall – Nano) recorded with a drone over the vineyard on August 29, 2022. NDVI (= Normalized Difference Vegetation Index) belongs to the vegetation indices, which can map the vitality of plants by using spectral information in the red and near-infrared. It has a defined value range and can be easily interpreted as healthy vegetation has values from 0.6 to 1 maximum.
-
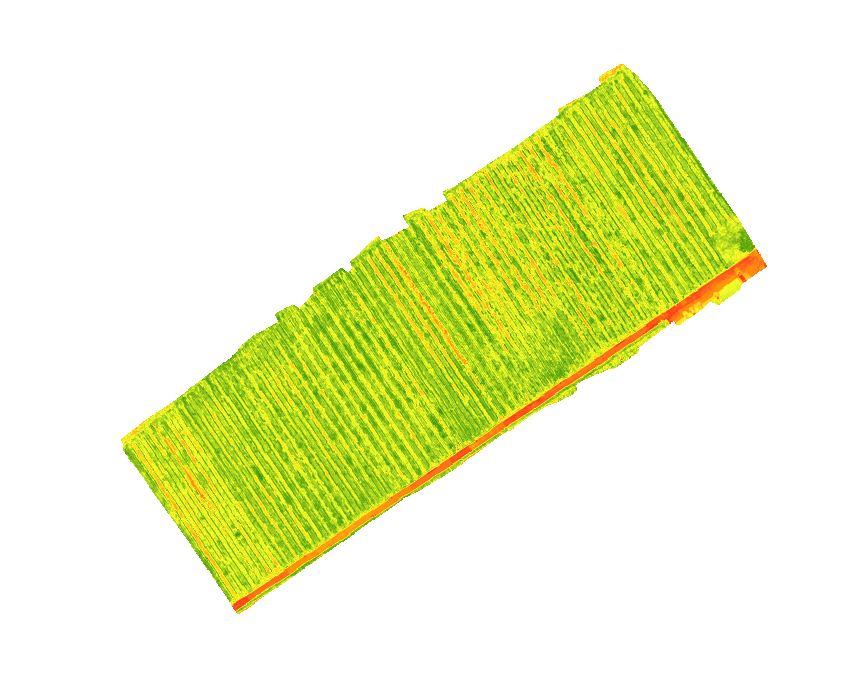
This layer shows the NDVI calculated using the spectral information from a hyperspectral camera (Headwall – Nano) recorded with a drone over the vineyard on September 13, 2021. NDVI (= Normalized Difference Vegetation Index) belongs to the vegetation indices, which can map the vitality of plants by using spectral information in the red and near-infrared. It has a defined value range and can be easily interpreted as healthy vegetation has values from 0.6 to 1 maximum.
-
This layer shows the NDVI calculated using the spectral information from a hyperspectral camera (Headwall – Nano) recorded with a drone over the vineyard on August 23, 2023. NDVI (= Normalized Difference Vegetation Index) belongs to the vegetation indices, which can map the vitality of plants by using spectral information in the red and near-infrared. It has a defined value range and can be easily interpreted as healthy vegetation has values from 0.6 to 1 maximum.
-

This layer shows the NDVI calculated using the spectral information from a hyperspectral camera (Headwall – Nano) recorded with a drone over the vineyard on July 30, 2020. NDVI (= Normalized Difference Vegetation Index) belongs to the vegetation indices, which can map the vitality of plants by using spectral information in the red and near-infrared. It has a defined value range and can be easily interpreted as healthy vegetation has values from 0.6 to 1 maximum.
-
This layer shows the NDVI calculated using the spectral information from a hyperspectral camera (Headwall – Nano) recorded with a drone over the vineyard on September 8, 2020. NDVI (= Normalized Difference Vegetation Index) belongs to the vegetation indices, which can map the vitality of plants by using spectral information in the red and near-infrared. It has a defined value range and can be easily interpreted as healthy vegetation has values from 0.6 to 1 maximum.
-
This layer shows the NDVI calculated using the spectral information from a hyperspectral camera (Headwall – Nano) recorded with a drone over the vineyard on August 22, 2023. NDVI (= Normalized Difference Vegetation Index) belongs to the vegetation indices, which can map the vitality of plants by using spectral information in the red and near-infrared. It has a defined value range and can be easily interpreted as healthy vegetation has values from 0.6 to 1 maximum.
-
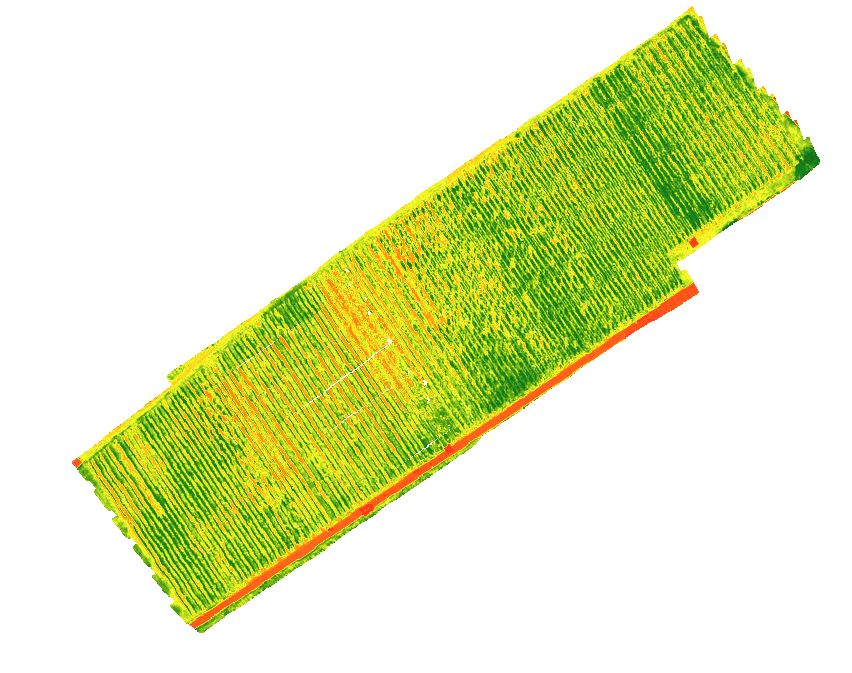
This layer shows the NDVI calculated using the spectral information from a hyperspectral camera (Headwall – Nano) recorded with a drone over the vineyard on September 3, 2019. NDVI (= Normalized Difference Vegetation Index) belongs to the vegetation indices, which can map the vitality of plants by using spectral information in the red and near-infrared. It has a defined value range and can be easily interpreted as healthy vegetation has values from 0.6 to 1 maximum.
-
CWSI (=crop water stress index) for the IVV vineyard in Remich. The CWSI is an index that can reflect the water stress of plants. High index values mean higher stress levels for the plants.
-
Surface temperature or plant temperature on August 22, 2023 in the IVV vineyard in Remich in °C. The temperature map was generated using a drone-based thermal camera.
-
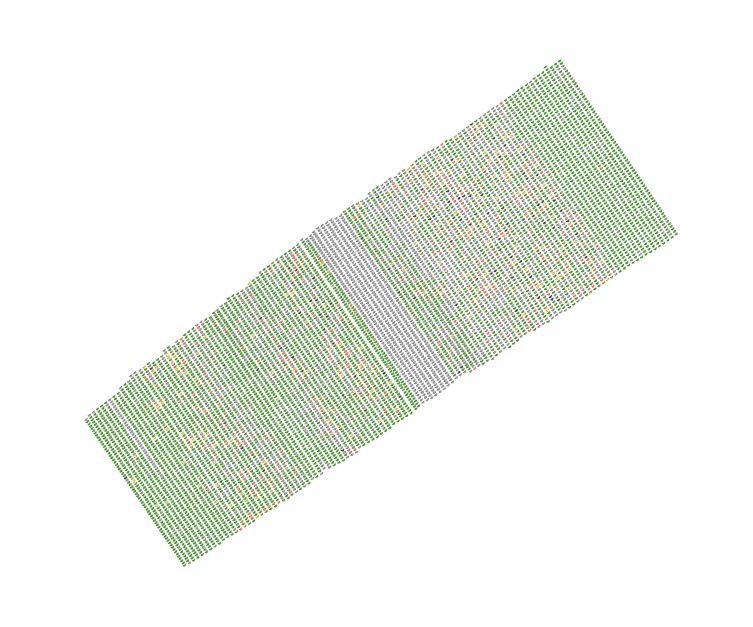
Field assessment / rating of the vines at the IVV 2021, classes 0 = healthy, 1 = apoplexy, 2A = mild ESCA symptoms, 2B = moderate ESCA symptoms, 2C = severe ESCA symptoms, X = missing vine