 geocatalogue.geoportail.lu
Environment>Climate protection
Type of resources
Available actions
Keywords
Contact for the resource
Provided by
Groups
Years
Representation types
Update frequencies
status
Scale
-
Layer description: In Luxembourg, there are a number of (inner-)urban green spaces that transport their cool air into the built environment at night. These so-called park winds, i.e. thermally induced balancing currents from an enclosed green space, occur on larger green spaces that are embedded in a significantly warmer environment. The winds emanating from the respective green spaces flow in almost all directions and extensively ventilate the surrounding built-up area. Most of these green spaces are also located on hills, so that the resulting surface winds are further intensified by the relief. Explanation: The present geodata are taken from the regional climate analysis of Luxembourg (GEO-NET & LIST 2021) which was published with the report « KLIMAÖKOLOGISCHE SITUATION IN LUXEMBURG“ - Modellbasierte regionale Klimaanalyse / (La situation au Luxembourg en matière d’écologie climatique) » by the Administration for Environment. Source: -> https://environnement.public.lu/fr/klima-an-energie/changement-climatique/klimaanalyse.html -> https://data.public.lu/fr/datasets/klimaokologische-situation-in-luxemburg-la-situation-au-luxembourg-en-matiere-decologie-climatique/ Abstracts: The Luxembourg regional climate, which is formed during a low-exchange radiative weather pattern in summer, was investigated using high-resolution computer-based modelling. In total, the model area is described with 8,272,693 grid cells, with information on terrain height, land use, structural height and degree of sealing stored for each grid cell. The urban climate model FITNAH-3D according to Groß (1992) forms the basic framework for the modelling. The input data and model results are based on a horizontal spatial resolution of 25 m x 25 m. The model results are presented in maps. The model results are presented in cartographic representations of the nocturnal temperature field, the nocturnal cold air flow field (4 a.m. in each case) and the thermal load during the day (2 p.m.) and concretised in the form of a climate analysis map. The main product of the work process is a planning recommendation map with an associated catalogue of measures. On the one hand, the map makes visible the graduated need for action to improve thermal comfort in summer in all living/working and recreational areas (“load area”) of the population in Luxembourg. On the other hand, the planning recommendation map also assigns a value to all green and open spaces in the country ("compensation area") with regard to the climate-ecological functions they provide. Notes: - The geodata are only to be used in the context of the specific considerations of the above-mentioned report (e.g.: basic data as of 2018, specific meteorological framework conditions). - The composition of the layers is based on the corresponding maps from the above-mentioned report. Even though these layers can be combined with any other layers from other thematic areas in the geoportal, it should be noted that these representations can easily lead to misinterpretations. - Detailed explanations of this layer and the modelling methodology can be found in the sources mentioned above. - The assessments of the planning recommendation map are based on the climate-ecological functions without taking into account the concerns of other sectoral plans, i.e. the planning recommendation maps represent weighting material obtained from a climate perspective.
-
Layer description: This data is part of the climate analysis map of Luxembourg. Shown is the bioclimatic situation in settlement and traffic areas (load area). The subject of the evaluation is the summertime human bioclimatic stress situation in the impact area at night. The higher the load, the greater the need for proactive adaptation measures. Explanation: The present geodata are taken from the regional climate analysis of Luxembourg (GEO-NET & LIST 2021) which was published with the report “KLIMAÖKOLOGISCHE SITUATION IN LUXEMBURG - Modellbasierte regionale Klimaanalyse / (La situation au Luxembourg en matière d’écologie climatique)” by the Administration for Environment. Source: -> https://environnement.public.lu/fr/klima-an-energie/changement-climatique/klimaanalyse.html -> https://data.public.lu/fr/datasets/klimaokologische-situation-in-luxemburg-la-situation-au-luxembourg-en-matiere-decologie-climatique/ Abstracts: The Luxembourg regional climate, which is formed during a low-exchange radiative weather pattern in summer, was investigated using high-resolution computer-based modelling. In total, the model area is described with 8,272,693 grid cells, with information on terrain height, land use, structural height and degree of sealing stored for each grid cell. The urban climate model FITNAH-3D according to Groß (1992) forms the basic framework for the modelling. The input data and model results are based on a horizontal spatial resolution of 25 m x 25 m. The model results are presented in maps. The model results are presented in cartographic representations of the nocturnal temperature field, the nocturnal cold air flow field (4 a.m. in each case) and the thermal load during the day (2 p.m.) and concretised in the form of a climate analysis map. The main product of the work process is a planning recommendation map with an associated catalogue of measures. On the one hand, the map makes visible the graduated need for action to improve thermal comfort in summer in all living/working and recreational areas (“load area”) of the population in Luxembourg. On the other hand, the planning recommendation map also assigns a value to all green and open spaces in the country ("compensation area") with regard to the climate-ecological functions they provide. Notes: - The geodata are only to be used in the context of the specific considerations of the above-mentioned report (e.g.: basic data as of 2018, specific meteorological framework conditions). - The composition of the layers is based on the corresponding maps from the above-mentioned report. Even though these layers can be combined with any other layers from other thematic areas in the geoportal, it should be noted that these representations can easily lead to misinterpretations. - Detailed explanations of this layer and the modelling methodology can be found in the sources mentioned above. - The assessments of the planning recommendation map are based on the climate-ecological functions without taking into account the concerns of other sectoral plans, i.e. the planning recommendation maps represent weighting material obtained from a climate perspective.
-
Layer description: Cold air production areas are an element of the climate analysis map Luxembourg. They identify green areas with a particularly high cold air production rate and feed the various cold air flows or in some cases even extend beyond them. Green areas were marked as cold air production areas if they produce at least 19 m³/m²h of cold air. The limit corresponds to the mean value of the cold air production rate of all Luxembourg green spaces (related to the situation at 4 a.m., 2 m above sea level). Explanation: The present geodata are taken from the regional climate analysis of Luxembourg (GEO-NET & LIST 2021) which was published with the report « KLIMAÖKOLOGISCHE SITUATION IN LUXEMBURG“ - Modellbasierte regionale Klimaanalyse / (La situation au Luxembourg en matière d’écologie climatique) » by the Administration for Environment. Source: -> https://environnement.public.lu/fr/klima-an-energie/changement-climatique/klimaanalyse.html -> https://data.public.lu/fr/datasets/klimaokologische-situation-in-luxemburg-la-situation-au-luxembourg-en-matiere-decologie-climatique/ Abstracts: The Luxembourg regional climate, which is formed during a low-exchange radiative weather pattern in summer, was investigated using high-resolution computer-based modelling. In total, the model area is described with 8,272,693 grid cells, with information on terrain height, land use, structural height and degree of sealing stored for each grid cell. The urban climate model FITNAH-3D according to Groß (1992) forms the basic framework for the modelling. The input data and model results are based on a horizontal spatial resolution of 25 m x 25 m. The model results are presented in maps. The model results are presented in cartographic representations of the nocturnal temperature field, the nocturnal cold air flow field (4 a.m. in each case) and the thermal load during the day (2 p.m.) and concretised in the form of a climate analysis map. The main product of the work process is a planning recommendation map with an associated catalogue of measures. On the one hand, the map makes visible the graduated need for action to improve thermal comfort in summer in all living/working and recreational areas (“load area”) of the population in Luxembourg. On the other hand, the planning recommendation map also assigns a value to all green and open spaces in the country ("compensation area") with regard to the climate-ecological functions they provide. Notes: - The geodata are only to be used in the context of the specific considerations of the above-mentioned report (e.g.: basic data as of 2018, specific meteorological framework conditions). - The composition of the layers is based on the corresponding maps from the above-mentioned report. Even though these layers can be combined with any other layers from other thematic areas in the geoportal, it should be noted that these representations can easily lead to misinterpretations.
-
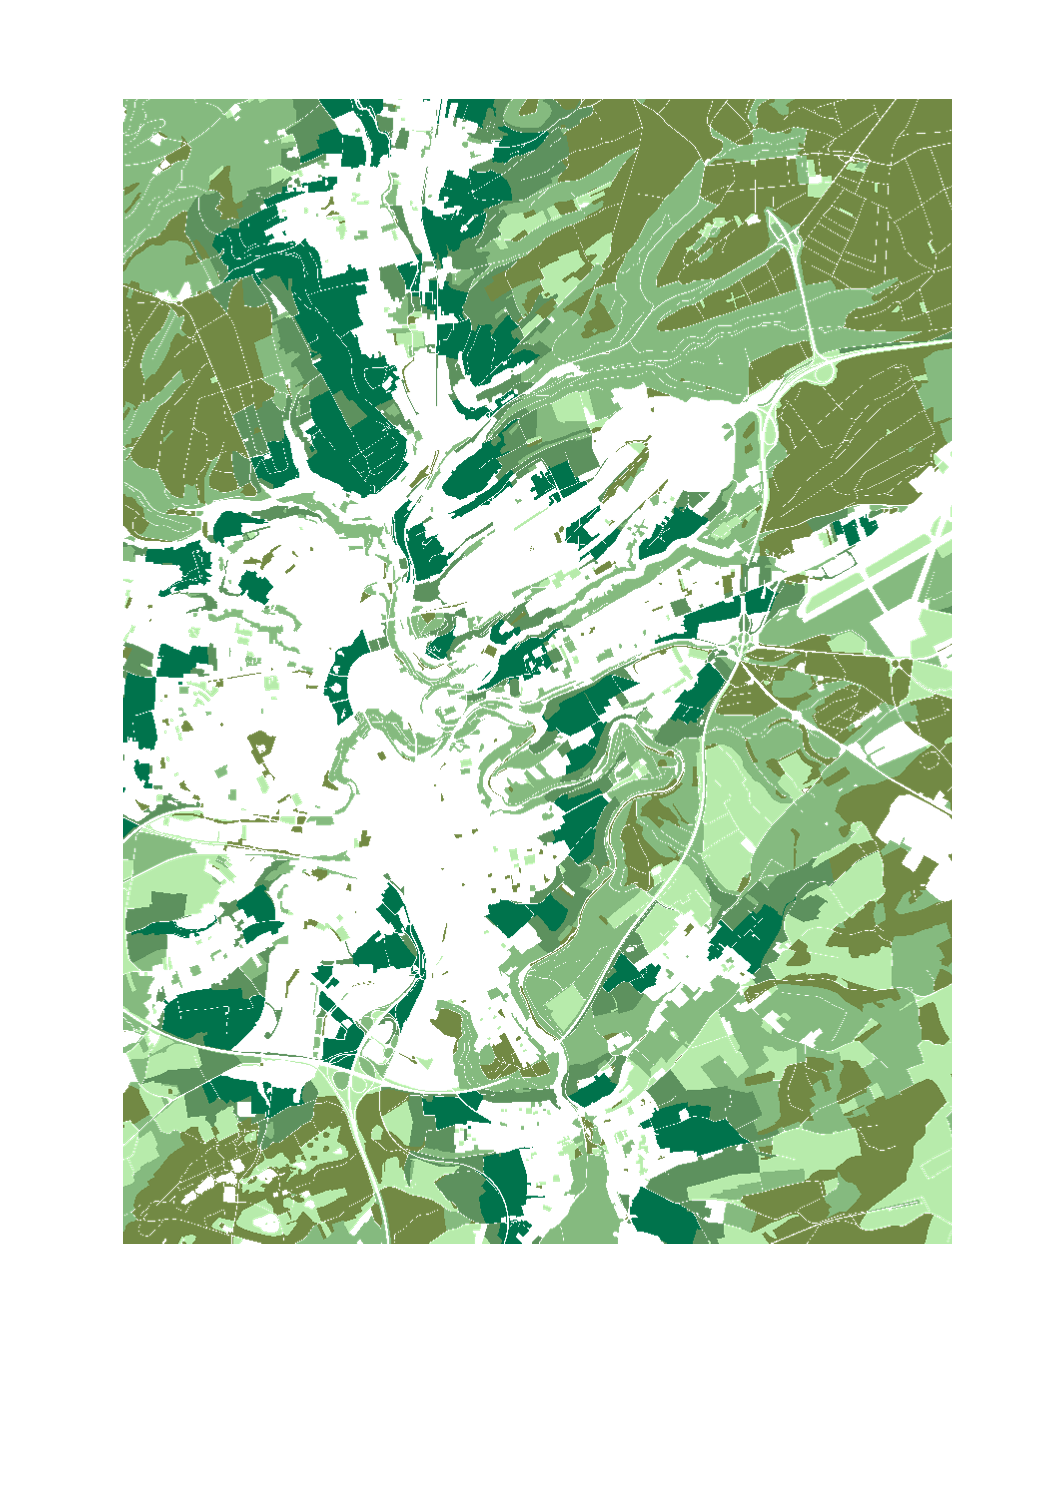
Layer description: This data is part of the climate analysis map of Luxembourg. Shown is the bioclimatic importance of green and open spaces (Compensation area). The subject of the assessment is the importance of green and open spaces in terms of the cold air balance in summer for relieving the impact area at night. The greater the importance, the greater the sensitivity of the area to intensification of use - especially construction - and therefore the greater its need for protection. Explanation: The present geodata are taken from the regional climate analysis of Luxembourg (GEO-NET & LIST 2021) which was published with the report “KLIMAÖKOLOGISCHE SITUATION IN LUXEMBURG - Modellbasierte regionale Klimaanalyse / (La situation au Luxembourg en matière d’écologie climatique)” by the Administration for Environment. Source: -> https://environnement.public.lu/fr/klima-an-energie/changement-climatique/klimaanalyse.html -> https://data.public.lu/fr/datasets/klimaokologische-situation-in-luxemburg-la-situation-au-luxembourg-en-matiere-decologie-climatique/ Abstracts: The Luxembourg regional climate, which is formed during a low-exchange radiative weather pattern in summer, was investigated using high-resolution computer-based modelling. In total, the model area is described with 8,272,693 grid cells, with information on terrain height, land use, structural height and degree of sealing stored for each grid cell. The urban climate model FITNAH-3D according to Groß (1992) forms the basic framework for the modelling. The input data and model results are based on a horizontal spatial resolution of 25 m x 25 m. The model results are presented in maps. The model results are presented in cartographic representations of the nocturnal temperature field, the nocturnal cold air flow field (4 a.m. in each case) and the thermal load during the day (2 p.m.) and concretised in the form of a climate analysis map. The main product of the work process is a planning recommendation map with an associated catalogue of measures. On the one hand, the map makes visible the graduated need for action to improve thermal comfort in summer in all living/working and recreational areas (“load area”) of the population in Luxembourg. On the other hand, the planning recommendation map also assigns a value to all green and open spaces in the country ("compensation area") with regard to the climate-ecological functions they provide. Notes: - The geodata are only to be used in the context of the specific considerations of the above-mentioned report (e.g.: basic data as of 2018, specific meteorological framework conditions). - The composition of the layers is based on the corresponding maps from the above-mentioned report. Even though these layers can be combined with any other layers from other thematic areas in the geoportal, it should be noted that these representations can easily lead to misinterpretations. - Detailed explanations of this layer and the modelling methodology can be found in the sources mentioned above. - The assessments of the planning recommendation map are based on the climate-ecological functions without taking into account the concerns of other sectoral plans, i.e. the planning recommendation maps represent weighting material obtained from a climate perspective.
-
.png)
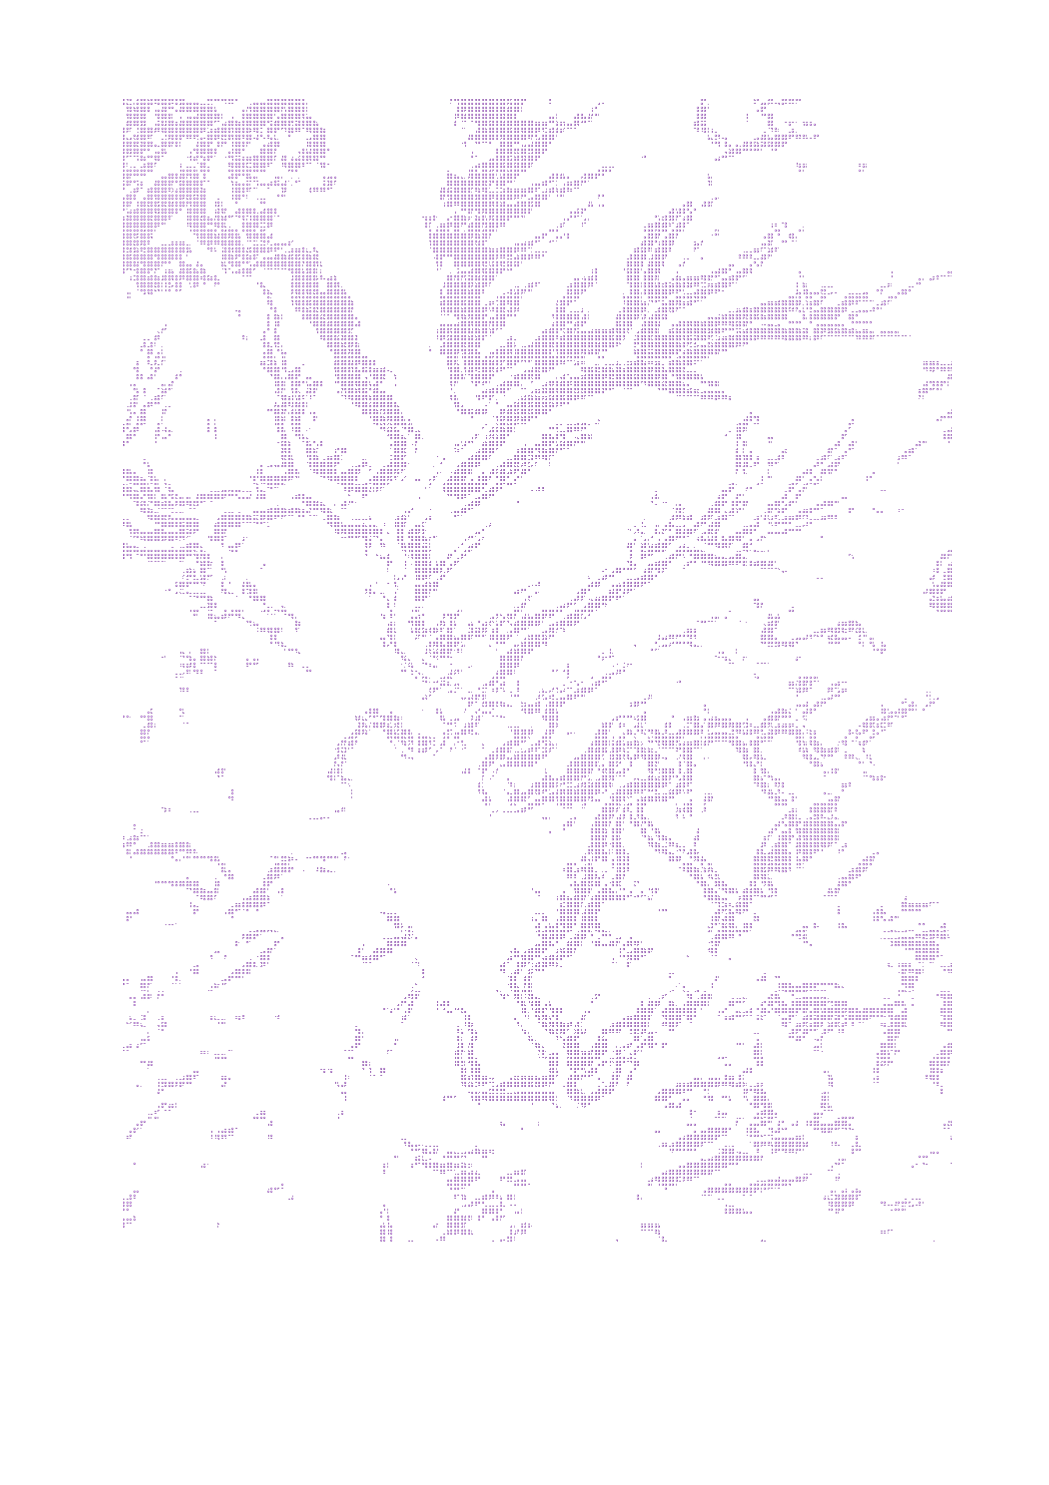
Layer description: This data is part of the climate analysis map of Luxembourg. Shown is the cold air volume flow density (4 a.m.) in the area of green and open spaces of Luxembourg. Explanation: The present geodata are taken from the regional climate analysis of Luxembourg (GEO-NET & LIST 2021) which was published with the report « KLIMAÖKOLOGISCHE SITUATION IN LUXEMBURG“ - Modellbasierte regionale Klimaanalyse / (La situation au Luxembourg en matière d’écologie climatique) » by the Administration for Environment. Source: -> https://environnement.public.lu/fr/klima-an-energie/changement-climatique/klimaanalyse.html -> https://data.public.lu/fr/datasets/klimaokologische-situation-in-luxemburg-la-situation-au-luxembourg-en-matiere-decologie-climatique/ Abstracts: The Luxembourg regional climate, which is formed during a low-exchange radiative weather pattern in summer, was investigated using high-resolution computer-based modelling. In total, the model area is described with 8,272,693 grid cells, with information on terrain height, land use, structural height and degree of sealing stored for each grid cell. The urban climate model FITNAH-3D according to Groß (1992) forms the basic framework for the modelling. The input data and model results are based on a horizontal spatial resolution of 25 m x 25 m. The model results are presented in maps. The model results are presented in cartographic representations of the nocturnal temperature field, the nocturnal cold air flow field (4 a.m. in each case) and the thermal load during the day (2 p.m.) and concretised in the form of a climate analysis map. The main product of the work process is a planning recommendation map with an associated catalogue of measures. On the one hand, the map makes visible the graduated need for action to improve thermal comfort in summer in all living/working and recreational areas (“load area”) of the population in Luxembourg. On the other hand, the planning recommendation map also assigns a value to all green and open spaces in the country ("compensation area") with regard to the climate-ecological functions they provide. Notes: - The geodata are only to be used in the context of the specific considerations of the above-mentioned report (e.g.: basic data as of 2018, specific meteorological framework conditions). - The composition of the layers is based on the corresponding maps from the above-mentioned report. Even though these layers can be combined with any other layers from other thematic areas in the geoportal, it should be noted that these representations can easily lead to misinterpretations.
-
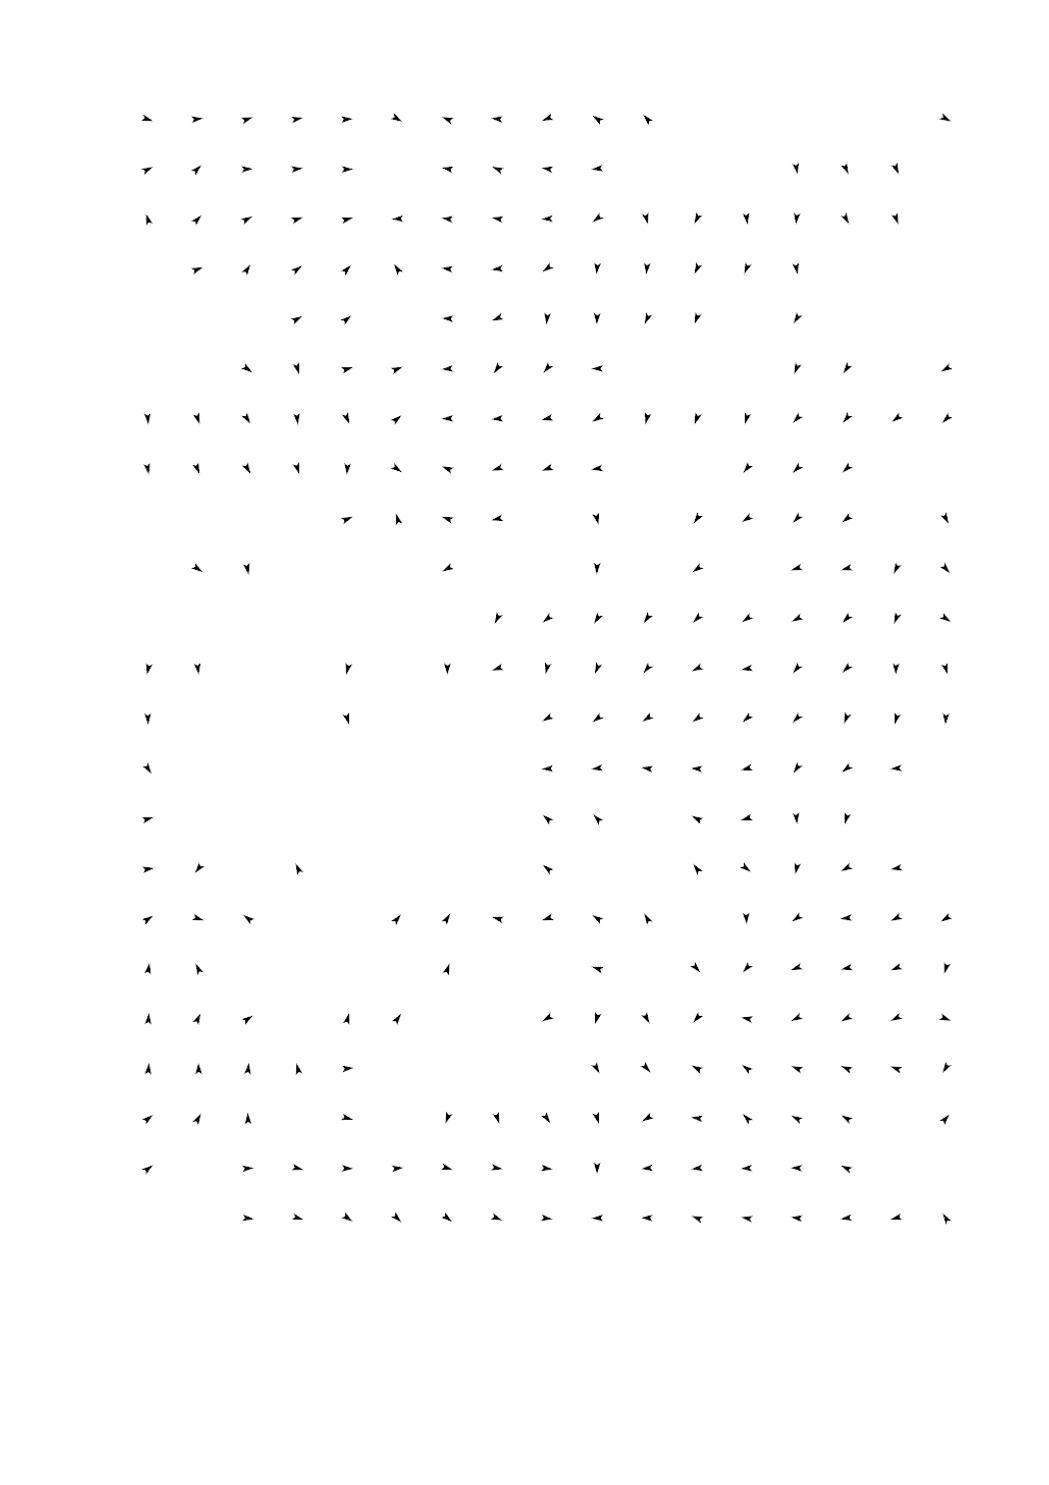
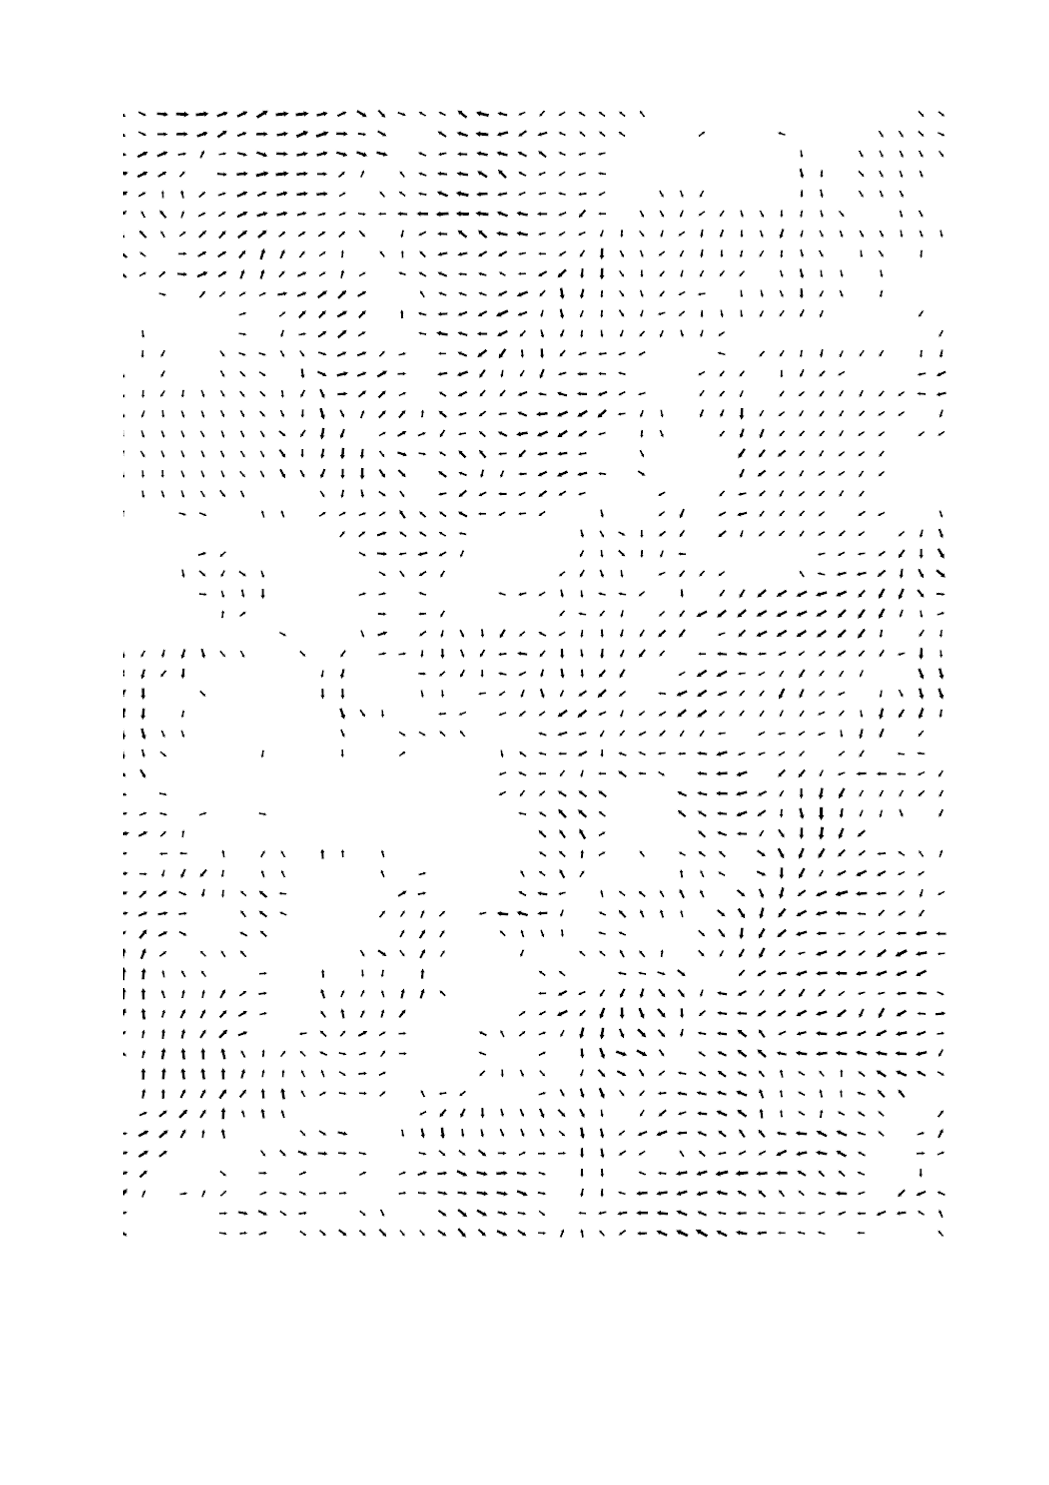
Layer description: The wind arrows ("flow direction of cold air") refer to the situation at 4 a.m. during a low-exchange radiation weather situation in summer. They are output at a height of 2 m above ground. The present wind arrows were aggregated (combined) from their original resolution of 25 m into a resolution of 25 m, 100 m , 200 m, 300 m, 500 m or 1000 m. The display is automatically adjusted to the respective zoom level (grid adjustment). Explanation: The present geodata are taken from the regional climate analysis of Luxembourg (GEO-NET & LIST 2021) which was published with the report « KLIMAÖKOLOGISCHE SITUATION IN LUXEMBURG“ - Modellbasierte regionale Klimaanalyse / (La situation au Luxembourg en matière d’écologie climatique) » by the Administration for Environment. Source: -> https://environnement.public.lu/fr/klima-an-energie/changement-climatique/klimaanalyse.html -> https://data.public.lu/fr/datasets/klimaokologische-situation-in-luxemburg-la-situation-au-luxembourg-en-matiere-decologie-climatique/ Abstracts: The Luxembourg regional climate, which is formed during a low-exchange radiative weather pattern in summer, was investigated using high-resolution computer-based modelling. In total, the model area is described with 8,272,693 grid cells, with information on terrain height, land use, structural height and degree of sealing stored for each grid cell. The urban climate model FITNAH-3D according to Groß (1992) forms the basic framework for the modelling. The input data and model results are based on a horizontal spatial resolution of 25 m x 25 m. The model results are presented in maps. The model results are presented in cartographic representations of the nocturnal temperature field, the nocturnal cold air flow field (4 a.m. in each case) and the thermal load during the day (2 p.m.) and concretised in the form of a climate analysis map. The main product of the work process is a planning recommendation map with an associated catalogue of measures. On the one hand, the map makes visible the graduated need for action to improve thermal comfort in summer in all living/working and recreational areas (“load area”) of the population in Luxembourg. On the other hand, the planning recommendation map also assigns a value to all green and open spaces in the country ("compensation area") with regard to the climate-ecological functions they provide. Notes: - The geodata are only to be used in the context of the specific considerations of the above-mentioned report (e.g.: basic data as of 2018, specific meteorological framework conditions). - The composition of the layers is based on the corresponding maps from the above-mentioned report. Even though these layers can be combined with any other layers from other thematic areas in the geoportal, it should be noted that these representations can easily lead to misinterpretations.
-
Layer description: Cold air exchange areas occur extensively over undeveloped areas, especially on slopes, and are oriented towards the settlement area. They are characterised by a near-ground flow velocity of mostly over 0.3 m/s or an above-average cold air volume flow density of over 16 m³/(s*m). Thus, they fulfil the same criteria as the cold-air corridors, but are not limited in width by adjacent structures (e.g. buildings or forests). Explanation: The present geodata are taken from the regional climate analysis of Luxembourg (GEO-NET & LIST 2021) which was published with the report « KLIMAÖKOLOGISCHE SITUATION IN LUXEMBURG“ - Modellbasierte regionale Klimaanalyse / (La situation au Luxembourg en matière d’écologie climatique) » by the Administration for Environment. Source: -> https://environnement.public.lu/fr/klima-an-energie/changement-climatique/klimaanalyse.html -> https://data.public.lu/fr/datasets/klimaokologische-situation-in-luxemburg-la-situation-au-luxembourg-en-matiere-decologie-climatique/ Abstracts: The Luxembourg regional climate, which is formed during a low-exchange radiative weather pattern in summer, was investigated using high-resolution computer-based modelling. In total, the model area is described with 8,272,693 grid cells, with information on terrain height, land use, structural height and degree of sealing stored for each grid cell. The urban climate model FITNAH-3D according to Groß (1992) forms the basic framework for the modelling. The input data and model results are based on a horizontal spatial resolution of 25 m x 25 m. The model results are presented in maps. The model results are presented in cartographic representations of the nocturnal temperature field, the nocturnal cold air flow field (4 a.m. in each case) and the thermal load during the day (2 p.m.) and concretised in the form of a climate analysis map. The main product of the work process is a planning recommendation map with an associated catalogue of measures. On the one hand, the map makes visible the graduated need for action to improve thermal comfort in summer in all living/working and recreational areas (“load area”) of the population in Luxembourg. On the other hand, the planning recommendation map also assigns a value to all green and open spaces in the country ("compensation area") with regard to the climate-ecological functions they provide. Notes: - The geodata are only to be used in the context of the specific considerations of the above-mentioned report (e.g.: basic data as of 2018, specific meteorological framework conditions). - The composition of the layers is based on the corresponding maps from the above-mentioned report. Even though these layers can be combined with any other layers from other thematic areas in the geoportal, it should be noted that these representations can easily lead to misinterpretations. - Detailed explanations of this layer and the modelling methodology can be found in the sources mentioned above. - The assessments of the planning recommendation map are based on the climate-ecological functions without taking into account the concerns of other sectoral plans, i.e. the planning recommendation maps represent weighting material obtained from a climate perspective.
-

Layer description: This layer shows the approximate wind direction in cold air corridors by means of the arrowhead. Cold air corridors are linear structures that connect cold air production areas (compensation areas) and impact areas (load areas) and represent an elementary component of air exchange. They are spatially limited in their width, but at least 50 m wide (Mayer et al. 1994) and are oriented towards the loaded settlement area. Luxembourg's cold air corridors are characterised by a near-ground flow velocity of mostly over 0.3 m/s or an above-average cold air volume flow density of over 16 m³/(s*m). In addition, they have a high proportion of vegetation, so that the air does not warm up significantly during transport and sufficient cold air can be carried into the city. Explanation: The present geodata are taken from the regional climate analysis of Luxembourg (GEO-NET & LIST 2021) which was published with the report « KLIMAÖKOLOGISCHE SITUATION IN LUXEMBURG“ - Modellbasierte regionale Klimaanalyse / (La situation au Luxembourg en matière d’écologie climatique) » by the Administration for Environment. Source: -> https://environnement.public.lu/fr/klima-an-energie/changement-climatique/klimaanalyse.html -> https://data.public.lu/fr/datasets/klimaokologische-situation-in-luxemburg-la-situation-au-luxembourg-en-matiere-decologie-climatique/ Abstracts: The Luxembourg regional climate, which is formed during a low-exchange radiative weather pattern in summer, was investigated using high-resolution computer-based modelling. In total, the model area is described with 8,272,693 grid cells, with information on terrain height, land use, structural height and degree of sealing stored for each grid cell. The urban climate model FITNAH-3D according to Groß (1992) forms the basic framework for the modelling. The input data and model results are based on a horizontal spatial resolution of 25 m x 25 m. The model results are presented in maps. The model results are presented in cartographic representations of the nocturnal temperature field, the nocturnal cold air flow field (4 a.m. in each case) and the thermal load during the day (2 p.m.) and concretised in the form of a climate analysis map. The main product of the work process is a planning recommendation map with an associated catalogue of measures. On the one hand, the map makes visible the graduated need for action to improve thermal comfort in summer in all living/working and recreational areas (“load area”) of the population in Luxembourg. On the other hand, the planning recommendation map also assigns a value to all green and open spaces in the country ("compensation area") with regard to the climate-ecological functions they provide. Notes: - The geodata are only to be used in the context of the specific considerations of the above-mentioned report (e.g.: basic data as of 2018, specific meteorological framework conditions). - The composition of the layers is based on the corresponding maps from the above-mentioned report. Even though these layers can be combined with any other layers from other thematic areas in the geoportal, it should be noted that these representations can easily lead to misinterpretations. - Detailed explanations of this layer and the modelling methodology can be found in the sources mentioned above. - The assessments of the planning recommendation map are based on the climate-ecological functions without taking into account the concerns of other sectoral plans, i.e. the planning recommendation maps represent weighting material obtained from a climate perspective.
-
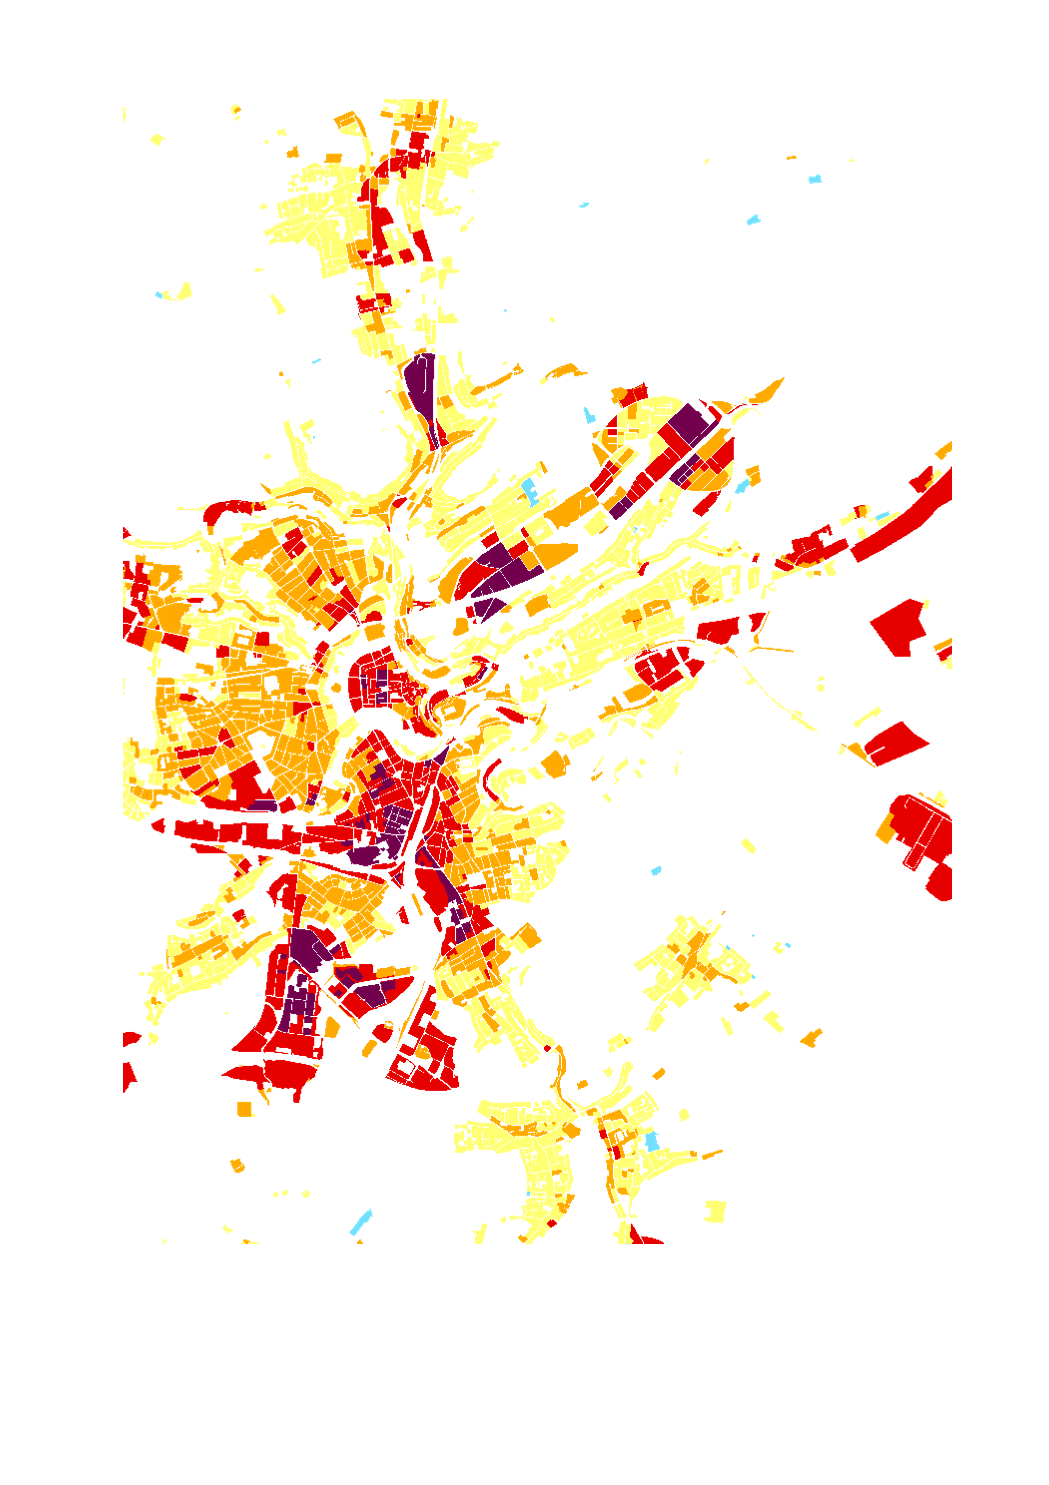
Layer description: These climate parameters are part of the climate analysis for Luxembourg. The heat load PET (Physiological Equivalent Temperature) during the day (2 p.m.) is shown, which describes the “felt temperature”. The PET (Physiologically Equivalent Temperature) is a human bioclimatic index for characterising the heat load of humans, which combines statements on air temperature, humidity, wind speed and short- and long-wave radiation flows and is derived from a heat balance model. The PET has the unit [°C] and refers to a height of 1.1 m above ground (centre of gravity of the human body) and to the situation at 2 p.m. during a low-exchange radiation weather situation in summer. Explanation: The present geodata are taken from the regional climate analysis of Luxembourg (GEO-NET & LIST 2021) which was published with the report “KLIMAÖKOLOGISCHE SITUATION IN LUXEMBURG - Modellbasierte regionale Klimaanalyse / (La situation au Luxembourg en matière d’écologie climatique)” by the Administration for Environment. Source: -> https://environnement.public.lu/fr/klima-an-energie/changement-climatique/klimaanalyse.html -> https://data.public.lu/fr/datasets/klimaokologische-situation-in-luxemburg-la-situation-au-luxembourg-en-matiere-decologie-climatique/ Abstracts: The Luxembourg regional climate, which is formed during a low-exchange radiative weather pattern in summer, was investigated using high-resolution computer-based modelling. In total, the model area is described with 8,272,693 grid cells, with information on terrain height, land use, structural height and degree of sealing stored for each grid cell. The urban climate model FITNAH-3D according to Groß (1992) forms the basic framework for the modelling. The input data and model results are based on a horizontal spatial resolution of 25 m x 25 m. The model results are presented in maps. The model results are presented in cartographic representations of the nocturnal temperature field, the nocturnal cold air flow field (4 a.m. in each case) and the thermal load during the day (2 p.m.) and concretised in the form of a climate analysis map. The main product of the work process is a planning recommendation map with an associated catalogue of measures. On the one hand, the map makes visible the graduated need for action to improve thermal comfort in summer in all living/working and recreational areas (“load area”) of the population in Luxembourg. On the other hand, the planning recommendation map also assigns a value to all green and open spaces in the country ("compensation area") with regard to the climate-ecological functions they provide. Notes: - The geodata are only to be used in the context of the specific considerations of the above-mentioned report (e.g.: basic data as of 2018, specific meteorological framework conditions). - The composition of the layers is based on the corresponding maps from the above-mentioned report. Even though these layers can be combined with any other layers from other thematic areas in the geoportal, it should be noted that these representations can easily lead to misinterpretations. - Detailed explanations of this layer and the modelling methodology can be found in the sources mentioned above. - The assessments of the planning recommendation map are based on the climate-ecological functions without taking into account the concerns of other sectoral plans, i.e. the planning recommendation maps represent weighting material obtained from a climate perspective.
-

Layer description: This layer shows the approximate wind direction in cold air corridors by means of the arrowhead. Cold air corridors are linear structures that connect cold air production areas (compensation areas) and impact areas (load areas) and represent an elementary component of air exchange. They are spatially limited in their width, but at least 50 m wide (Mayer et al. 1994) and are oriented towards the loaded settlement area. Luxembourg's cold air corridors are characterised by a near-ground flow velocity of mostly over 0.3 m/s or an above-average cold air volume flow density of over 16 m³/(s*m). In addition, they have a high proportion of vegetation, so that the air does not warm up significantly during transport and sufficient cold air can be carried into the city. Explanation: The present geodata are taken from the regional climate analysis of Luxembourg (GEO-NET & LIST 2021) which was published with the report « KLIMAÖKOLOGISCHE SITUATION IN LUXEMBURG“ - Modellbasierte regionale Klimaanalyse / (La situation au Luxembourg en matière d’écologie climatique) » by the Administration for Environment. Source: -> https://environnement.public.lu/fr/klima-an-energie/changement-climatique/klimaanalyse.html -> https://data.public.lu/fr/datasets/klimaokologische-situation-in-luxemburg-la-situation-au-luxembourg-en-matiere-decologie-climatique/ Abstracts: The Luxembourg regional climate, which is formed during a low-exchange radiative weather pattern in summer, was investigated using high-resolution computer-based modelling. In total, the model area is described with 8,272,693 grid cells, with information on terrain height, land use, structural height and degree of sealing stored for each grid cell. The urban climate model FITNAH-3D according to Groß (1992) forms the basic framework for the modelling. The input data and model results are based on a horizontal spatial resolution of 25 m x 25 m. The model results are presented in maps. The model results are presented in cartographic representations of the nocturnal temperature field, the nocturnal cold air flow field (4 a.m. in each case) and the thermal load during the day (2 p.m.) and concretised in the form of a climate analysis map. The main product of the work process is a planning recommendation map with an associated catalogue of measures. On the one hand, the map makes visible the graduated need for action to improve thermal comfort in summer in all living/working and recreational areas (“load area”) of the population in Luxembourg. On the other hand, the planning recommendation map also assigns a value to all green and open spaces in the country ("compensation area") with regard to the climate-ecological functions they provide. Notes: - The geodata are only to be used in the context of the specific considerations of the above-mentioned report (e.g.: basic data as of 2018, specific meteorological framework conditions). - The composition of the layers is based on the corresponding maps from the above-mentioned report. Even though these layers can be combined with any other layers from other thematic areas in the geoportal, it should be noted that these representations can easily lead to misinterpretations.